User Guide / Formatting Point Clouds
A Guide to Formatting Point Clouds
- Uploading Point Cloud Data
- Editing Point Cloud Data
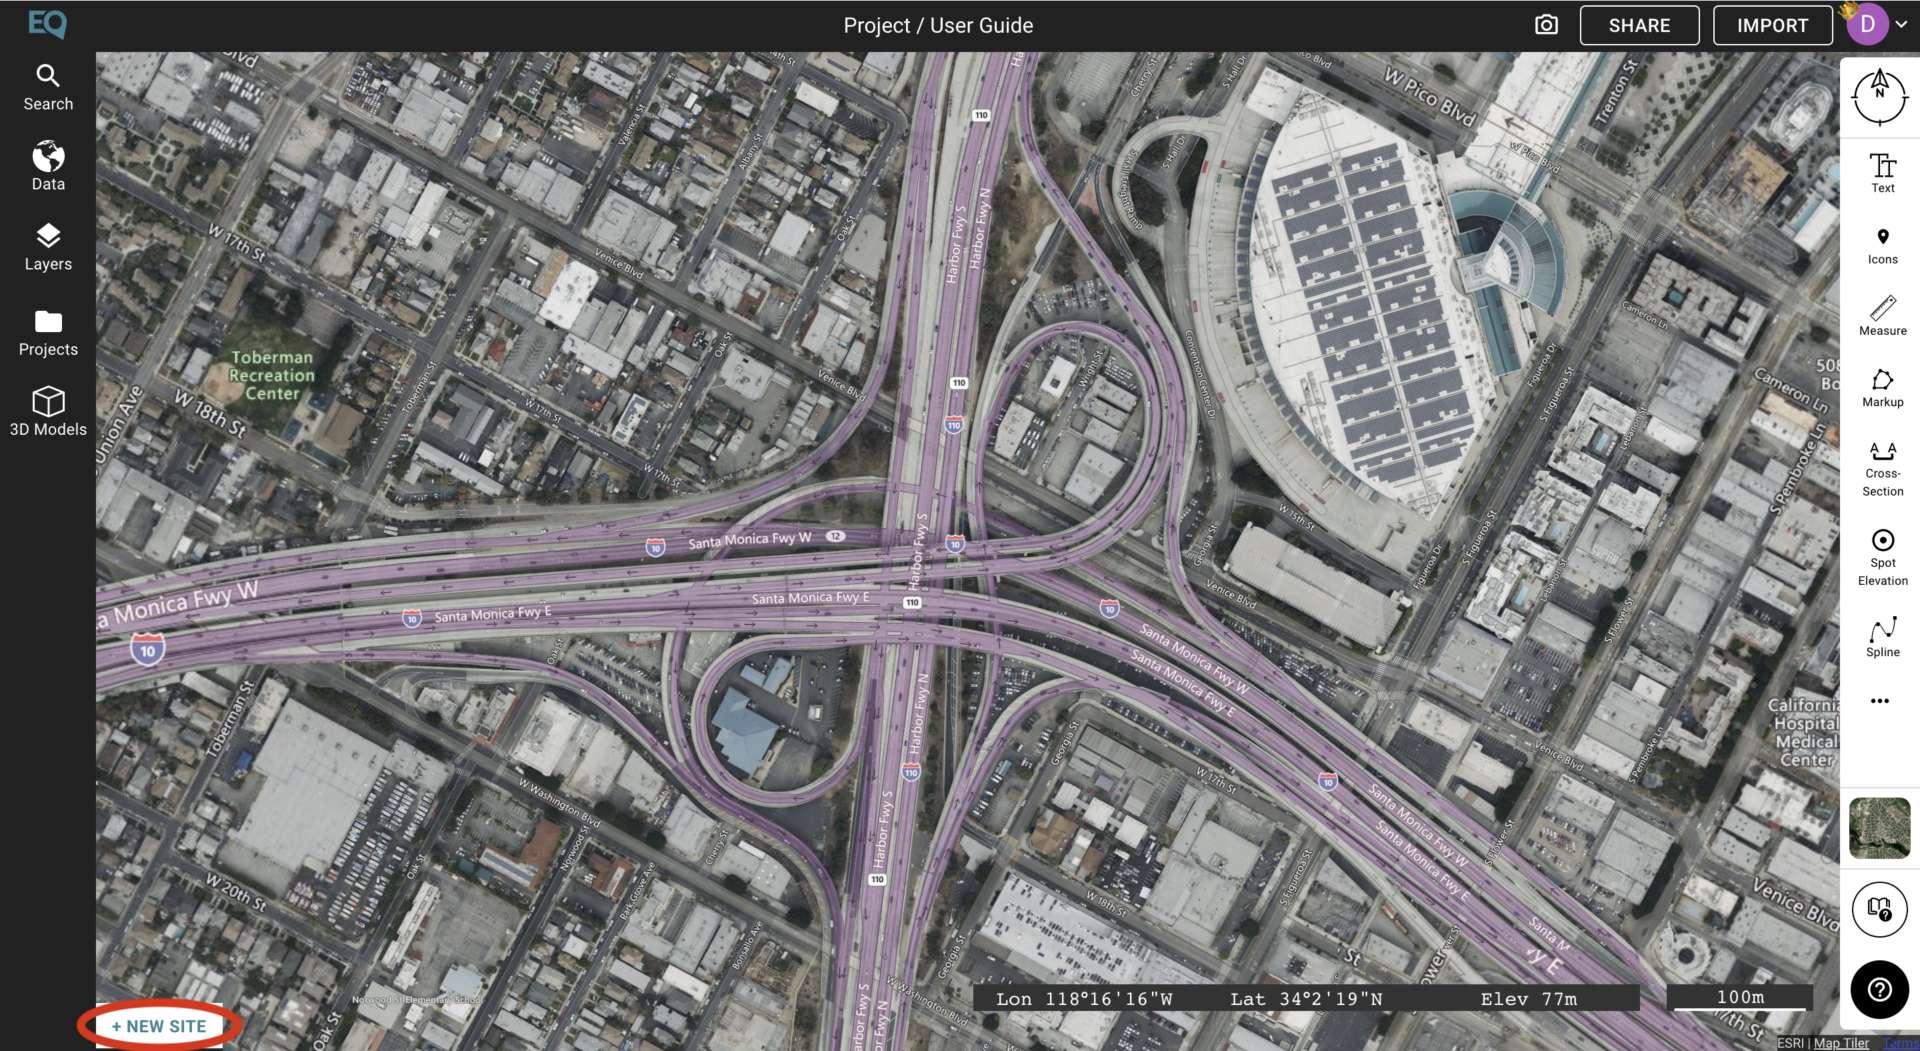
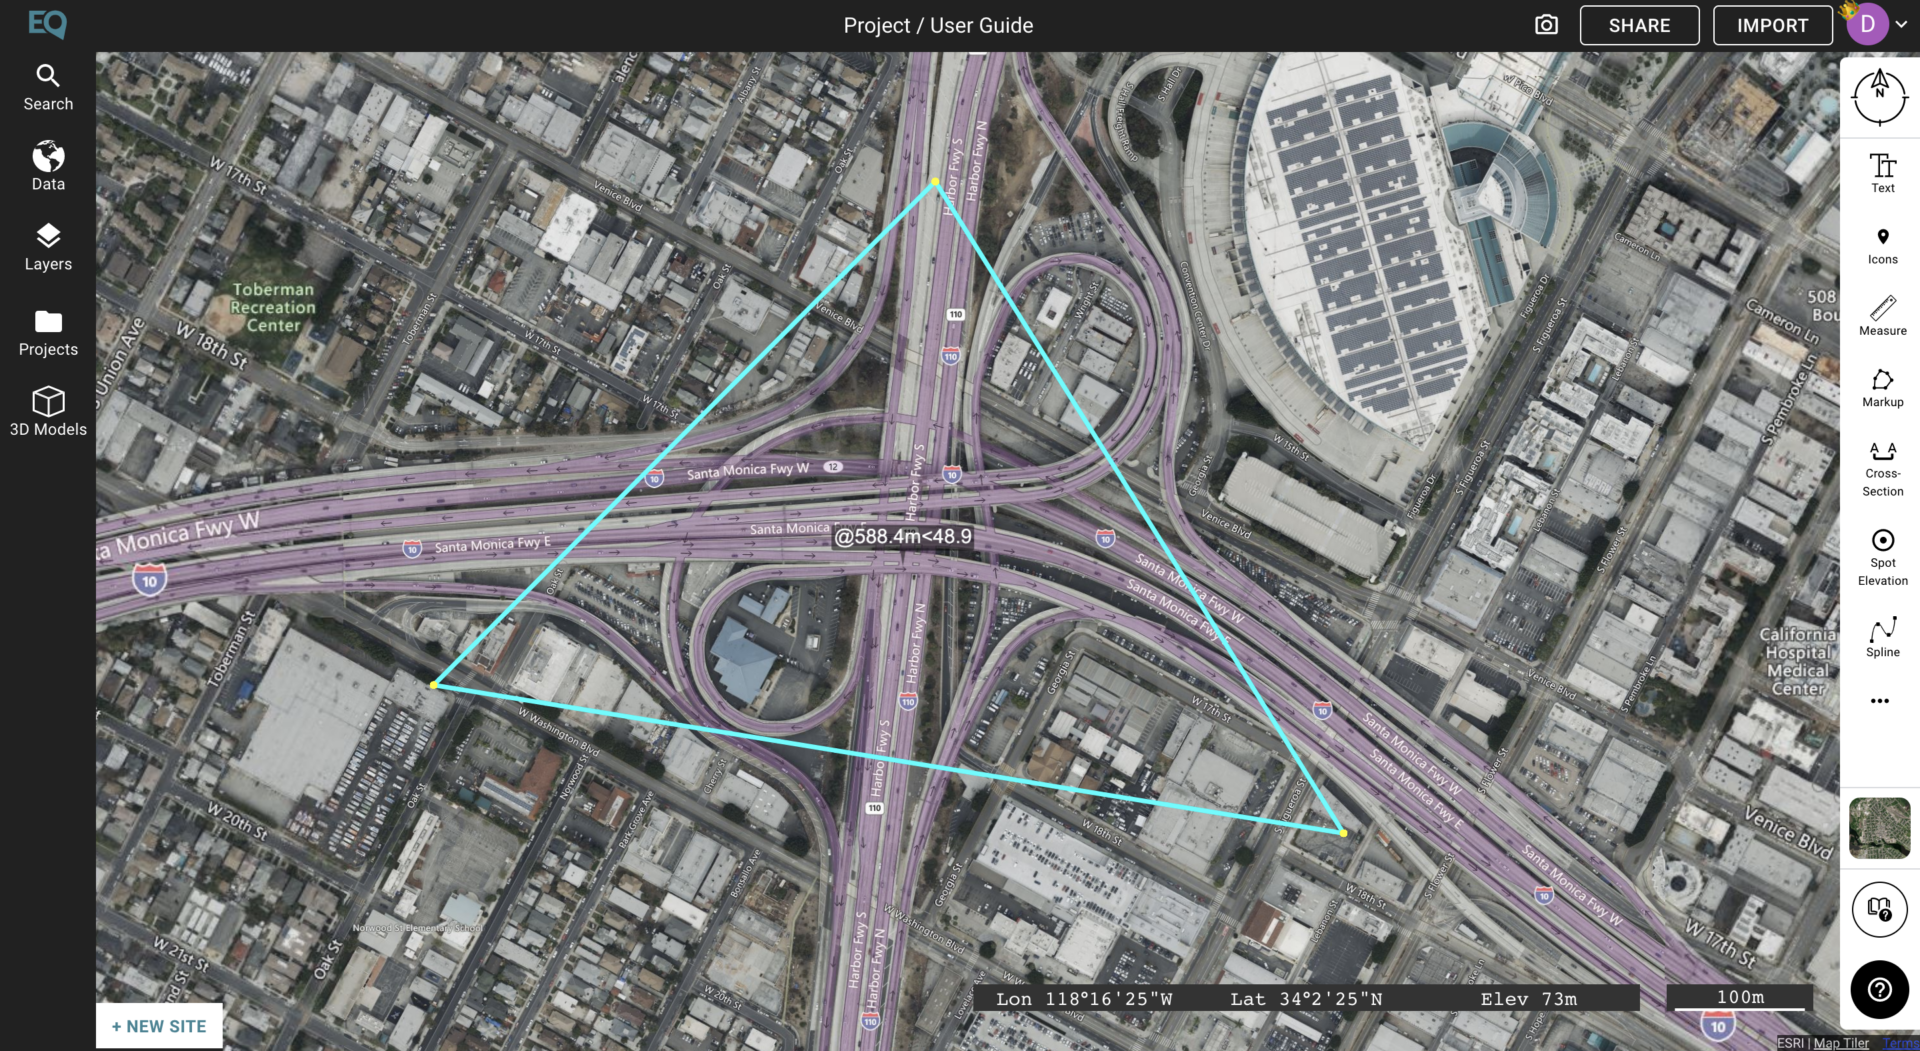
Begin by choosing an area where you would like to capture a Point Cloud image. Once you have done this, select the “New Site” button in the bottom left corner.
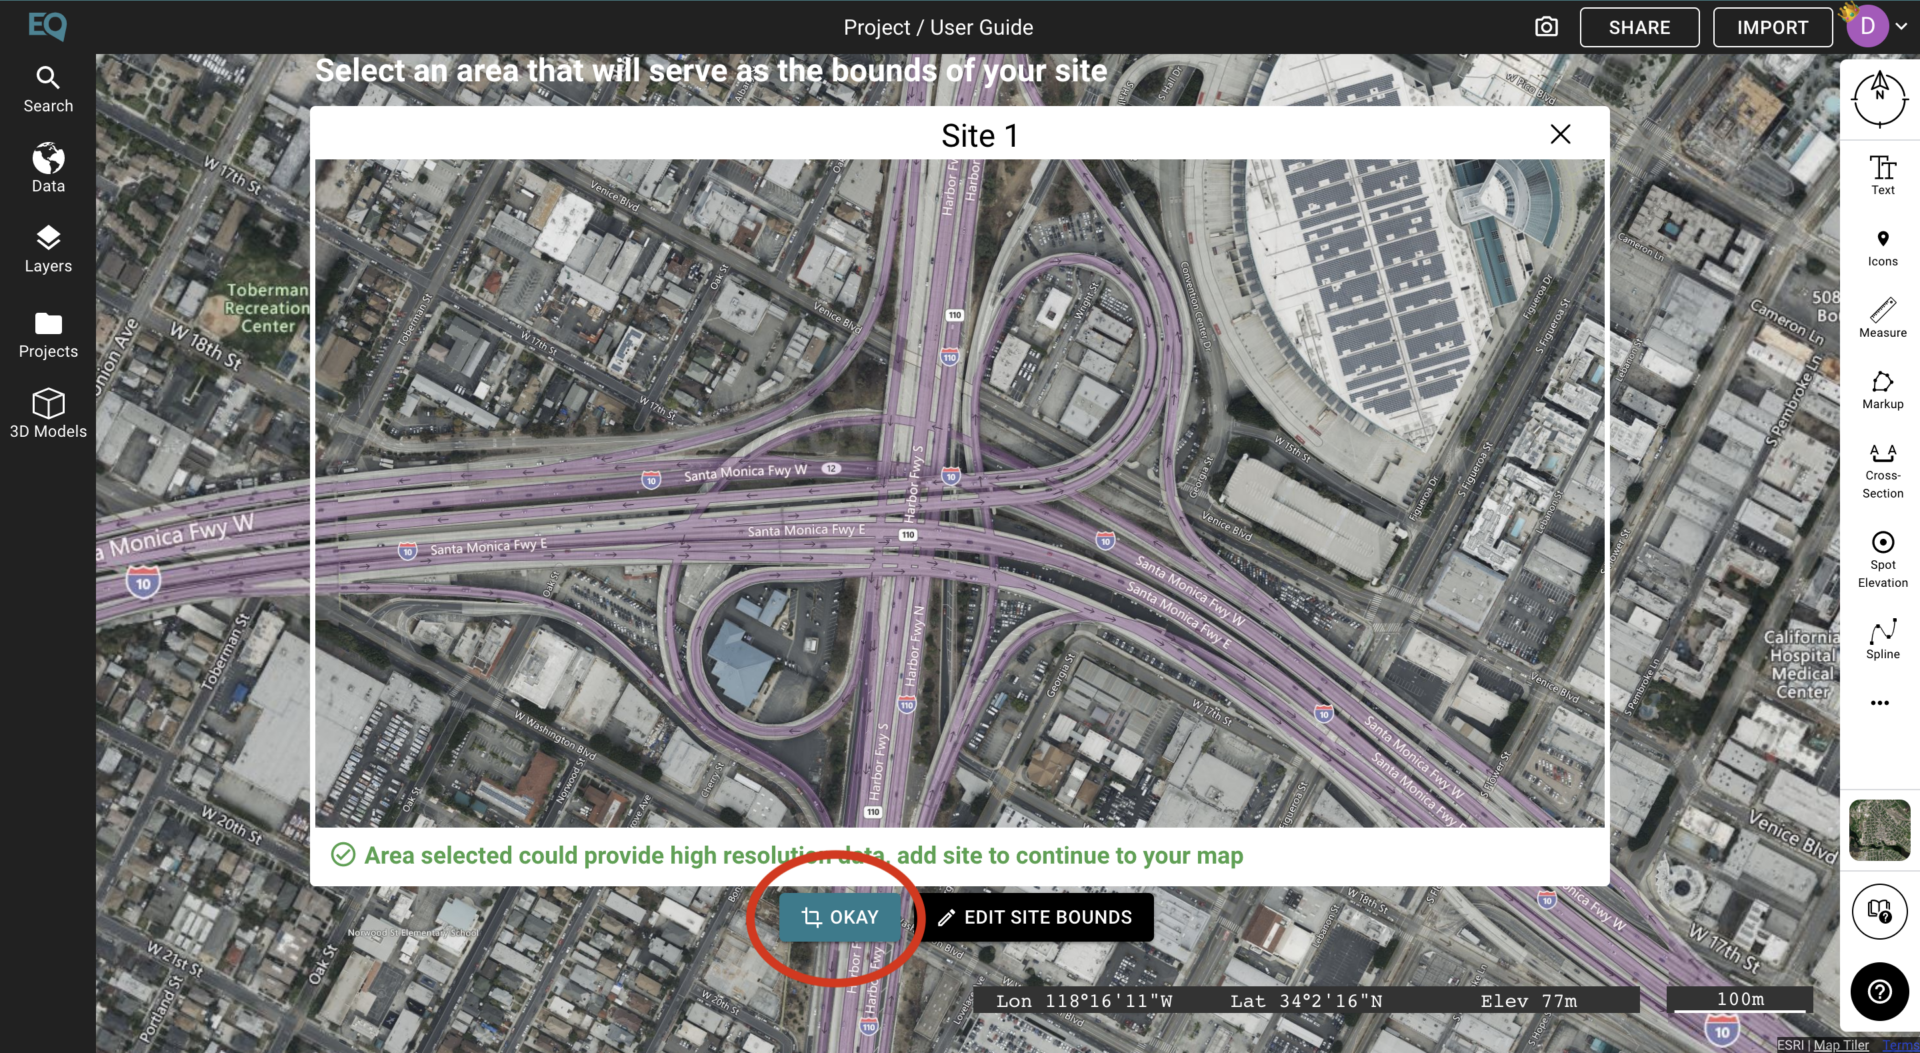
A white rectangle labeling your site bounds will then appear. To confirm the selection click the blue “Okay” button.
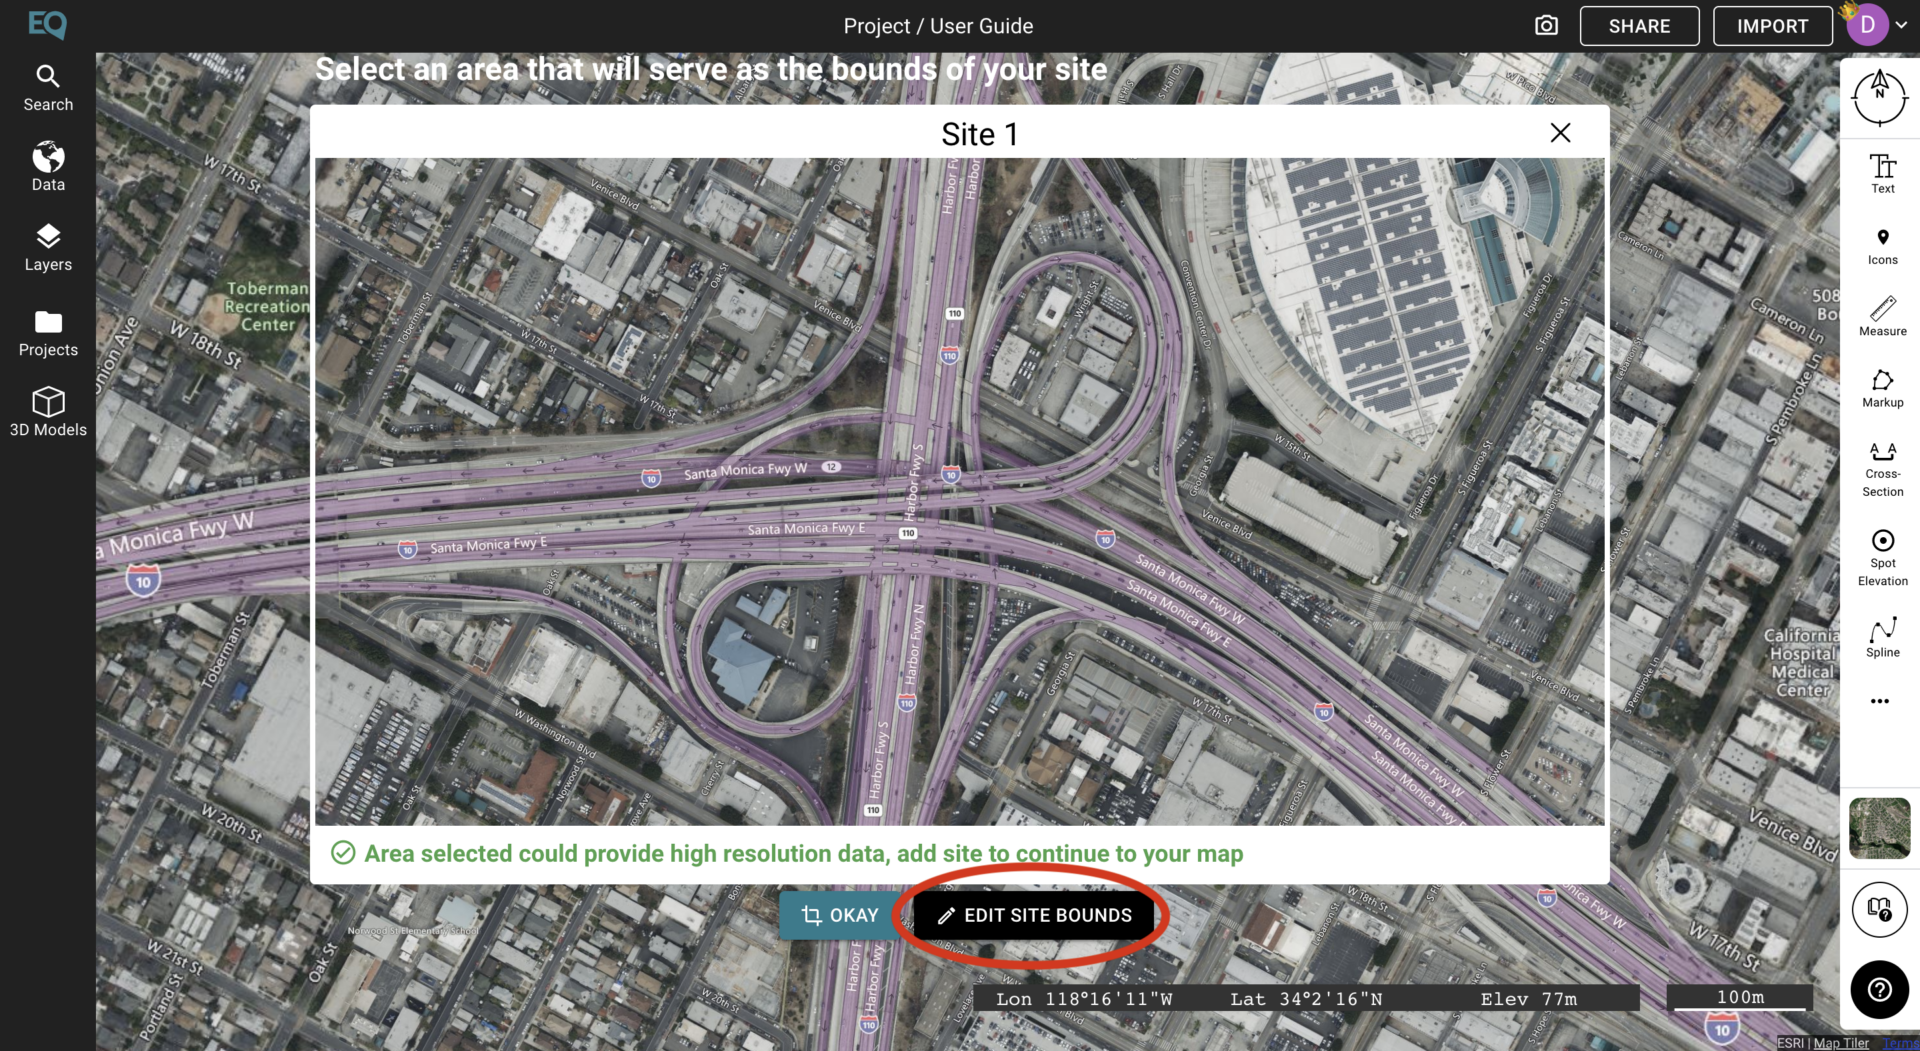
To create a custom site, select the “Edit Site Bounds” button.
With this option, you can create a polygon by clicking points that you would like to create on your map. To finish the polygon/shape and create the new site, click on the first point that you created.
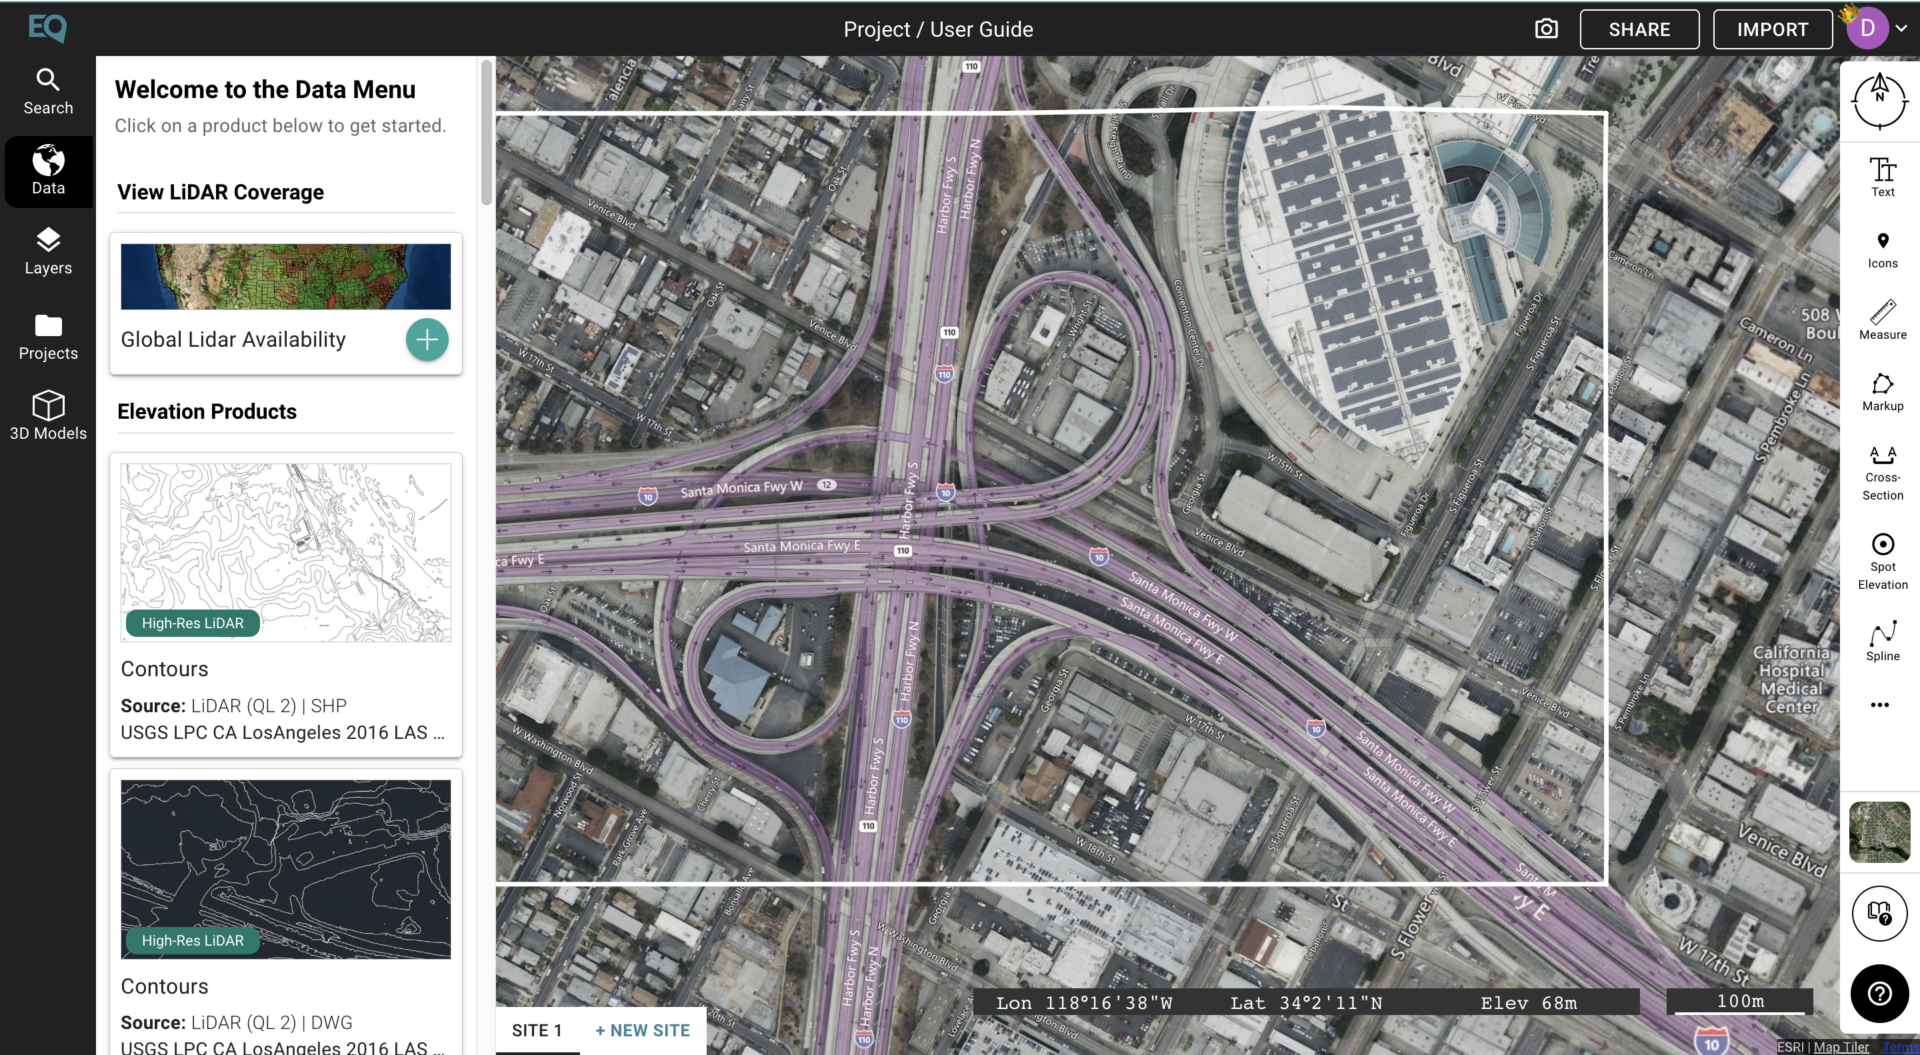
Both options will lead to the opening of the “Data” sidebar. This will allow you to view the possible options for topographic data.
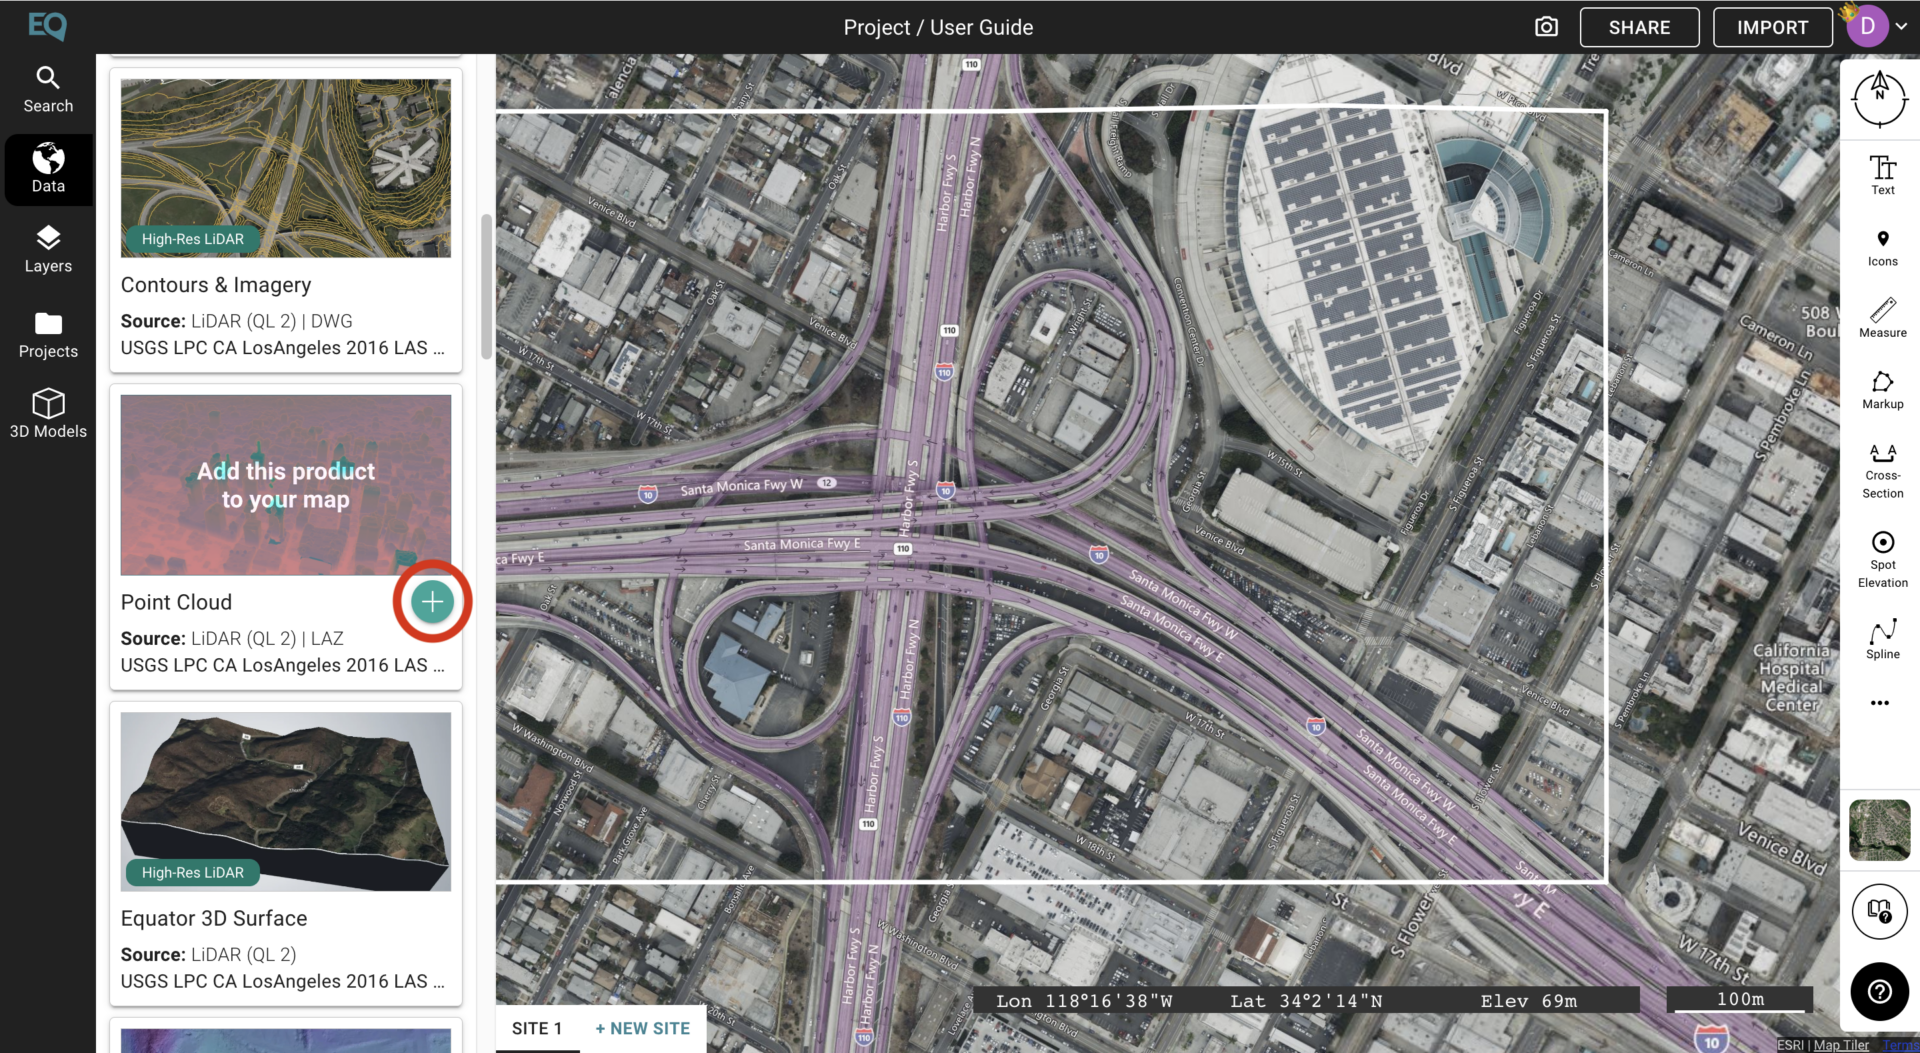
To view the Point Cloud Data option, scroll down. Once you hover over this with your mouse, click on the button with a plus symbol that appears.
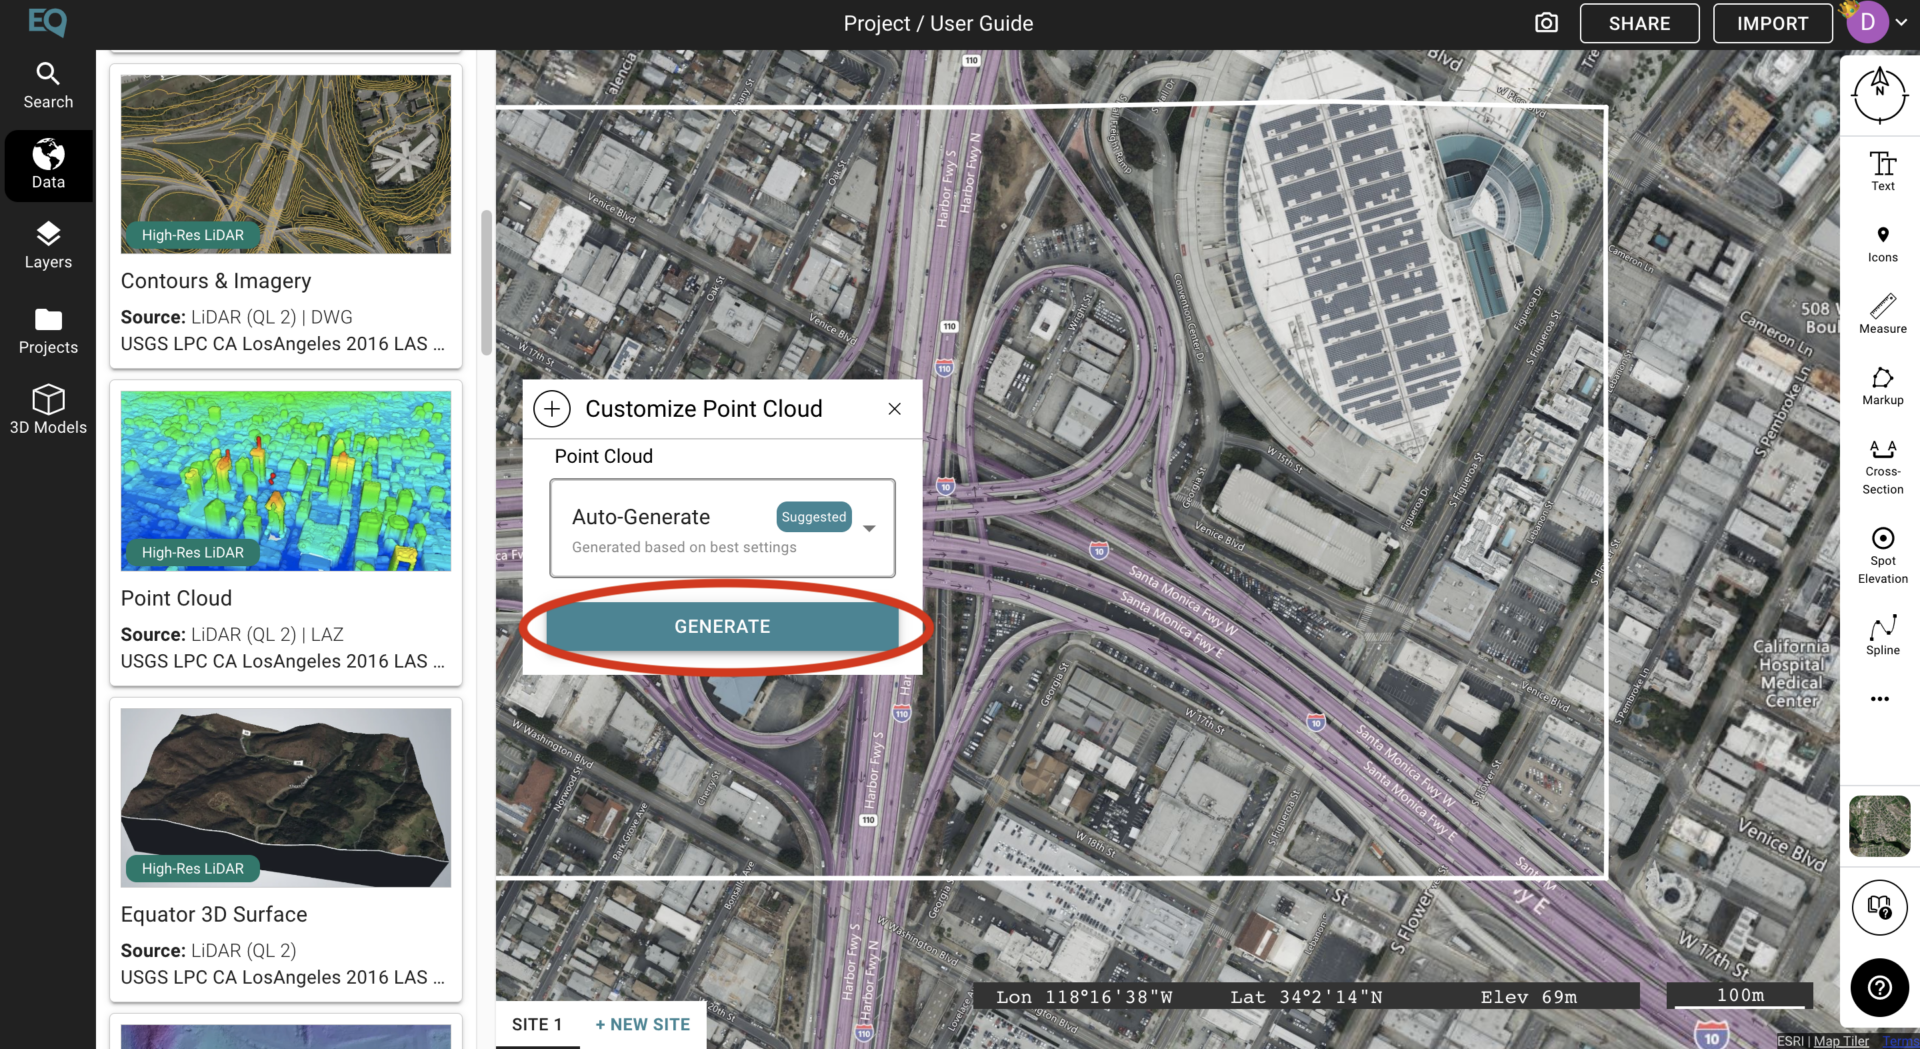
Once you click the plus button, another smaller menu will appear. Click on the Generate button to view your point cloud.
Once this is done, the data will load onto the site. The lowest points in the site will appear as blue, while the highest points will appear as a dark red. To edit the uploaded Point Cloud data, click the “Layers” button on the left side menu.
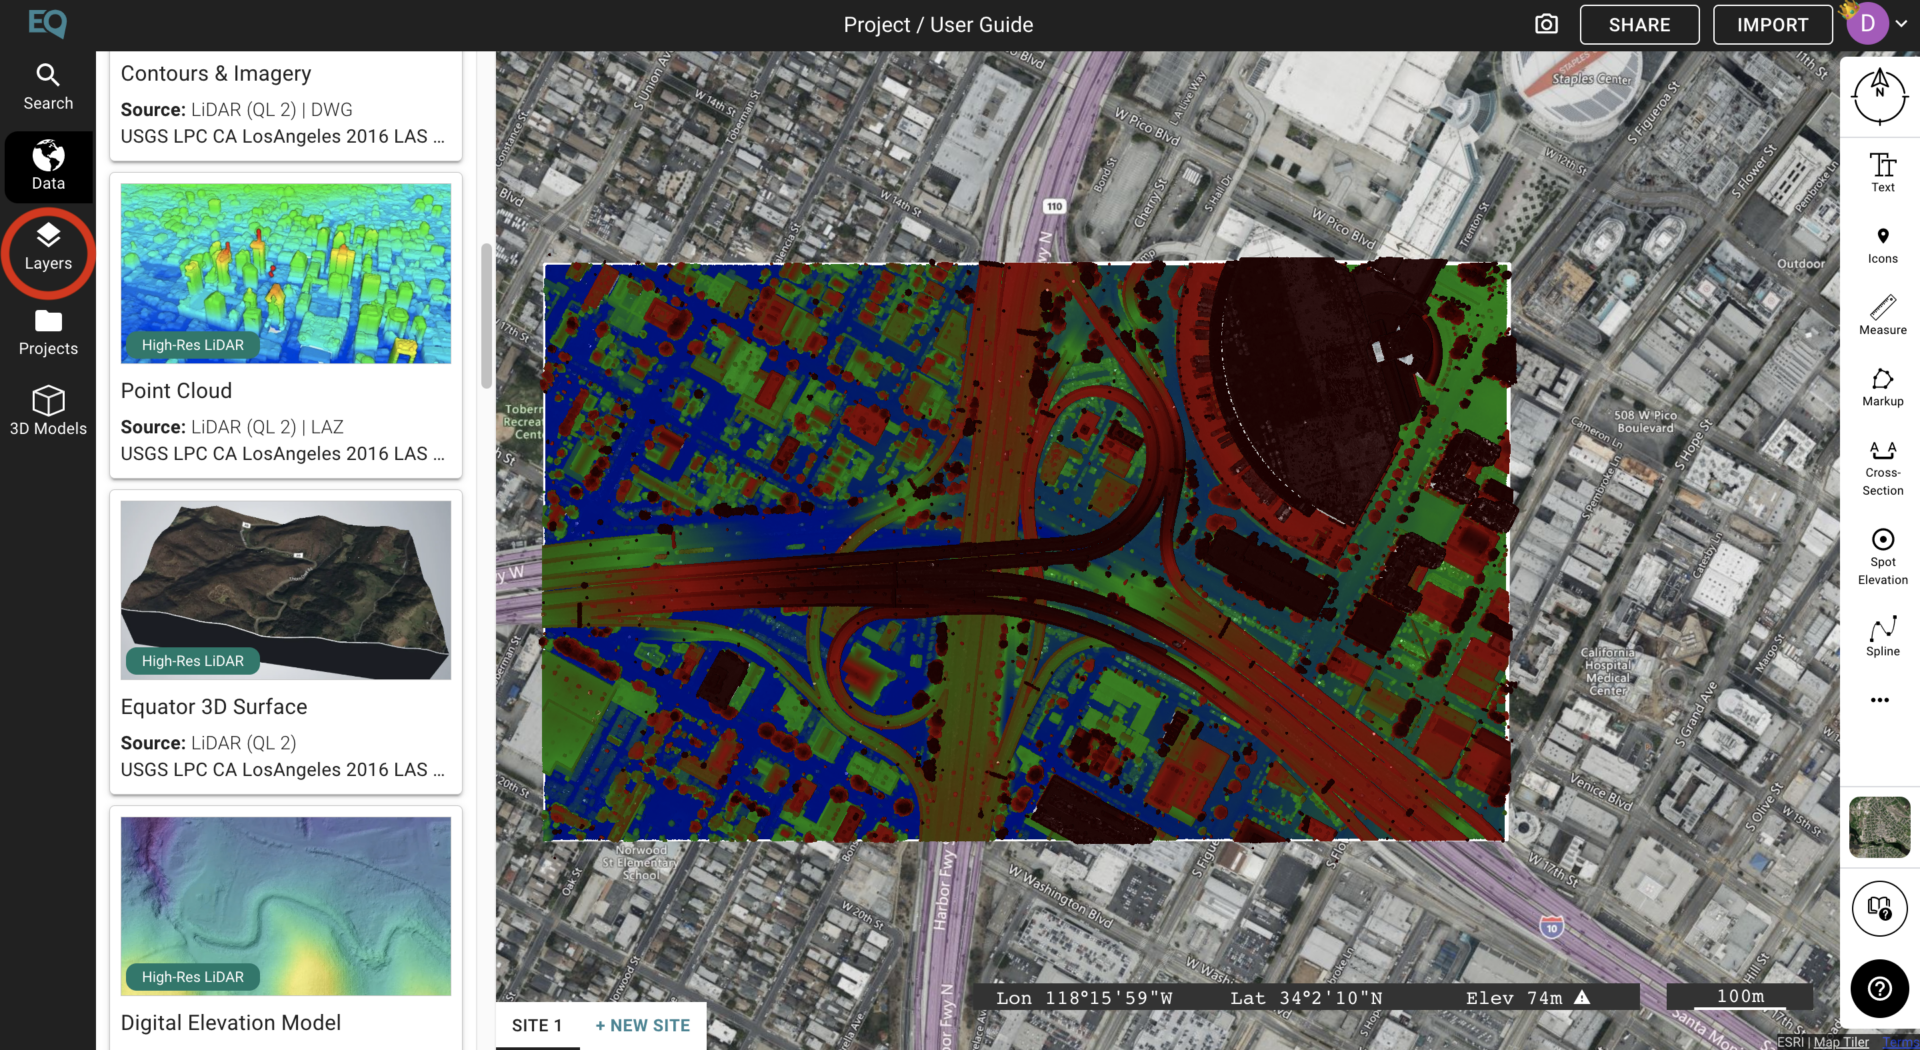
To edit the appearance of the point cloud data, click the “Point Cloud” layer.
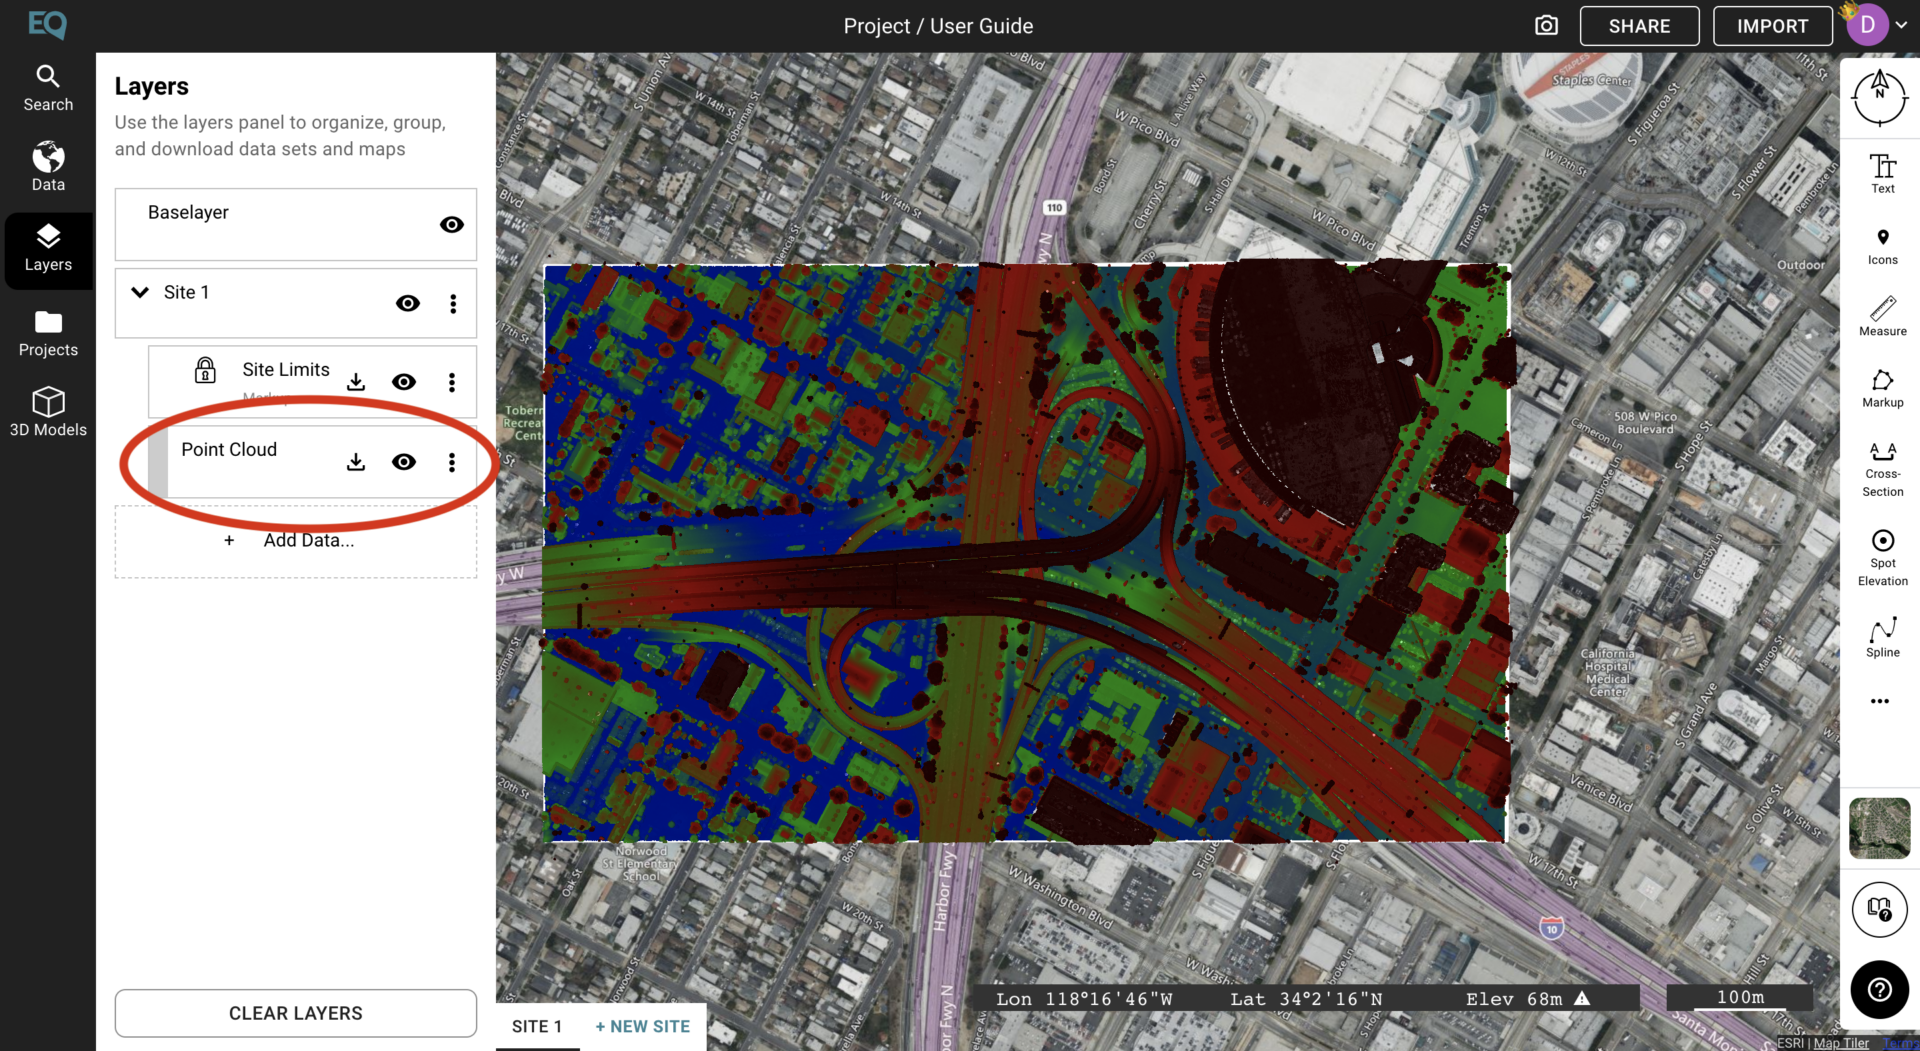
The formatting menu lets you alter the height range, intensity range, and point size of the point cloud.
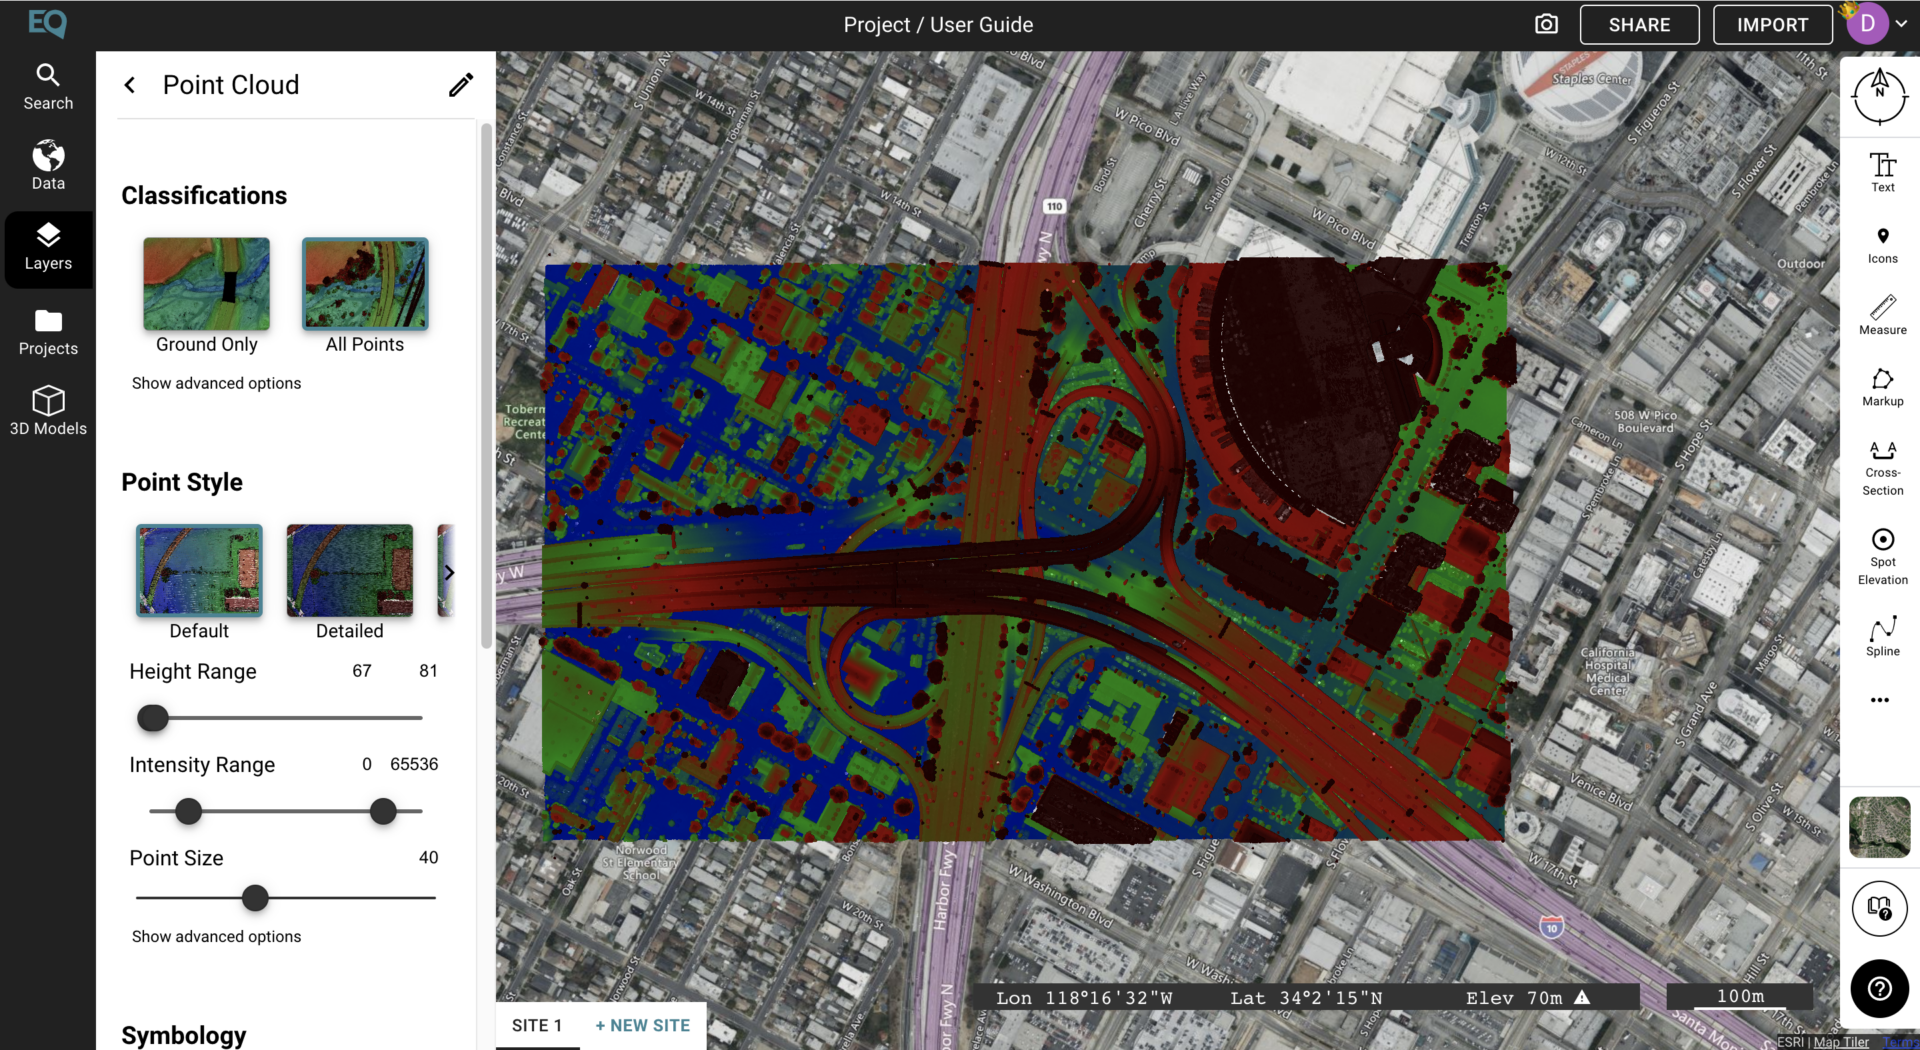
By selecting the “Ground Only” option, you create an image with only points on the ground showing, excluding vegetation and buildings.
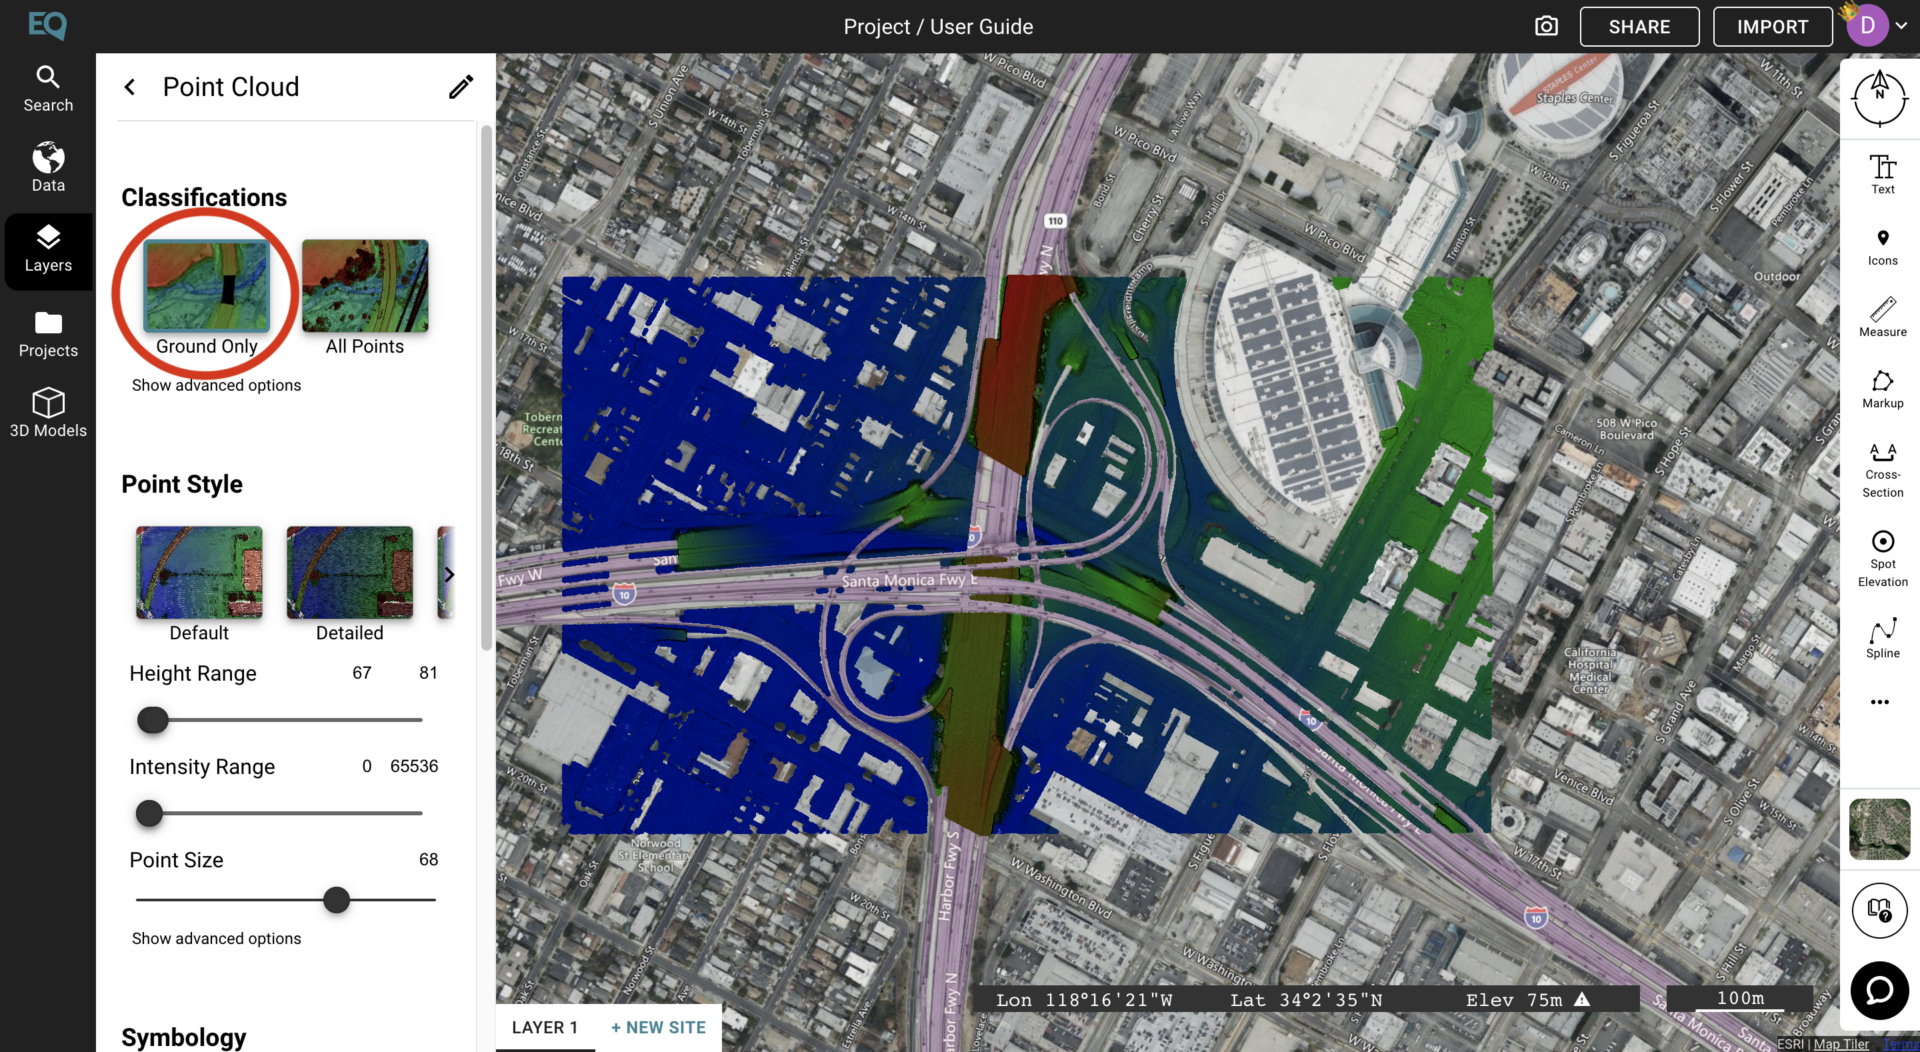
To edit the point style, you can choose between the three Point Style options. These options range in the size of the points from Default to Filled.
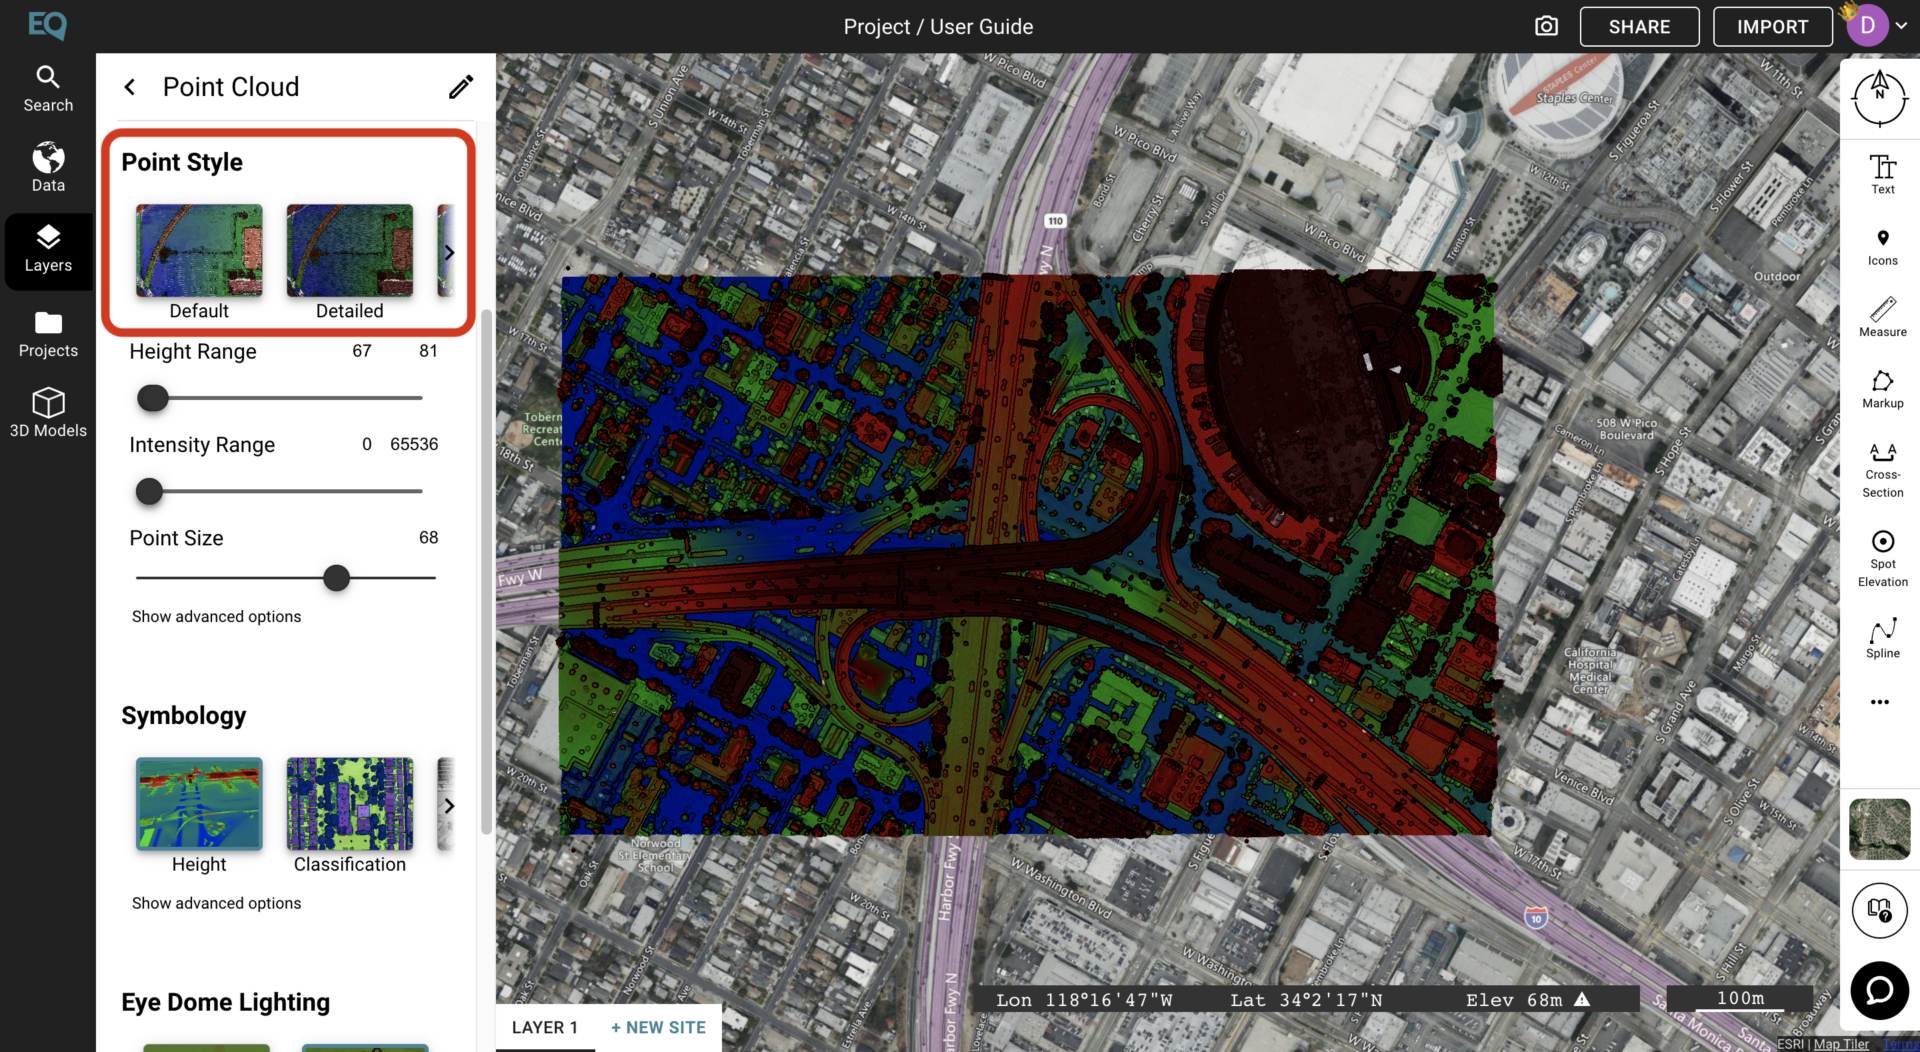
The Height range determines how the Point Cloud data will look, as it alters what height the different colours represent. By increasing the lowest point of the height range, more of the selected area is viewed in the lower end of the colour spectrum (blue) If you were to decrease the highest point of the height range, more of the data would appear as high points. This would lead the data to appear in more dark and red colours.
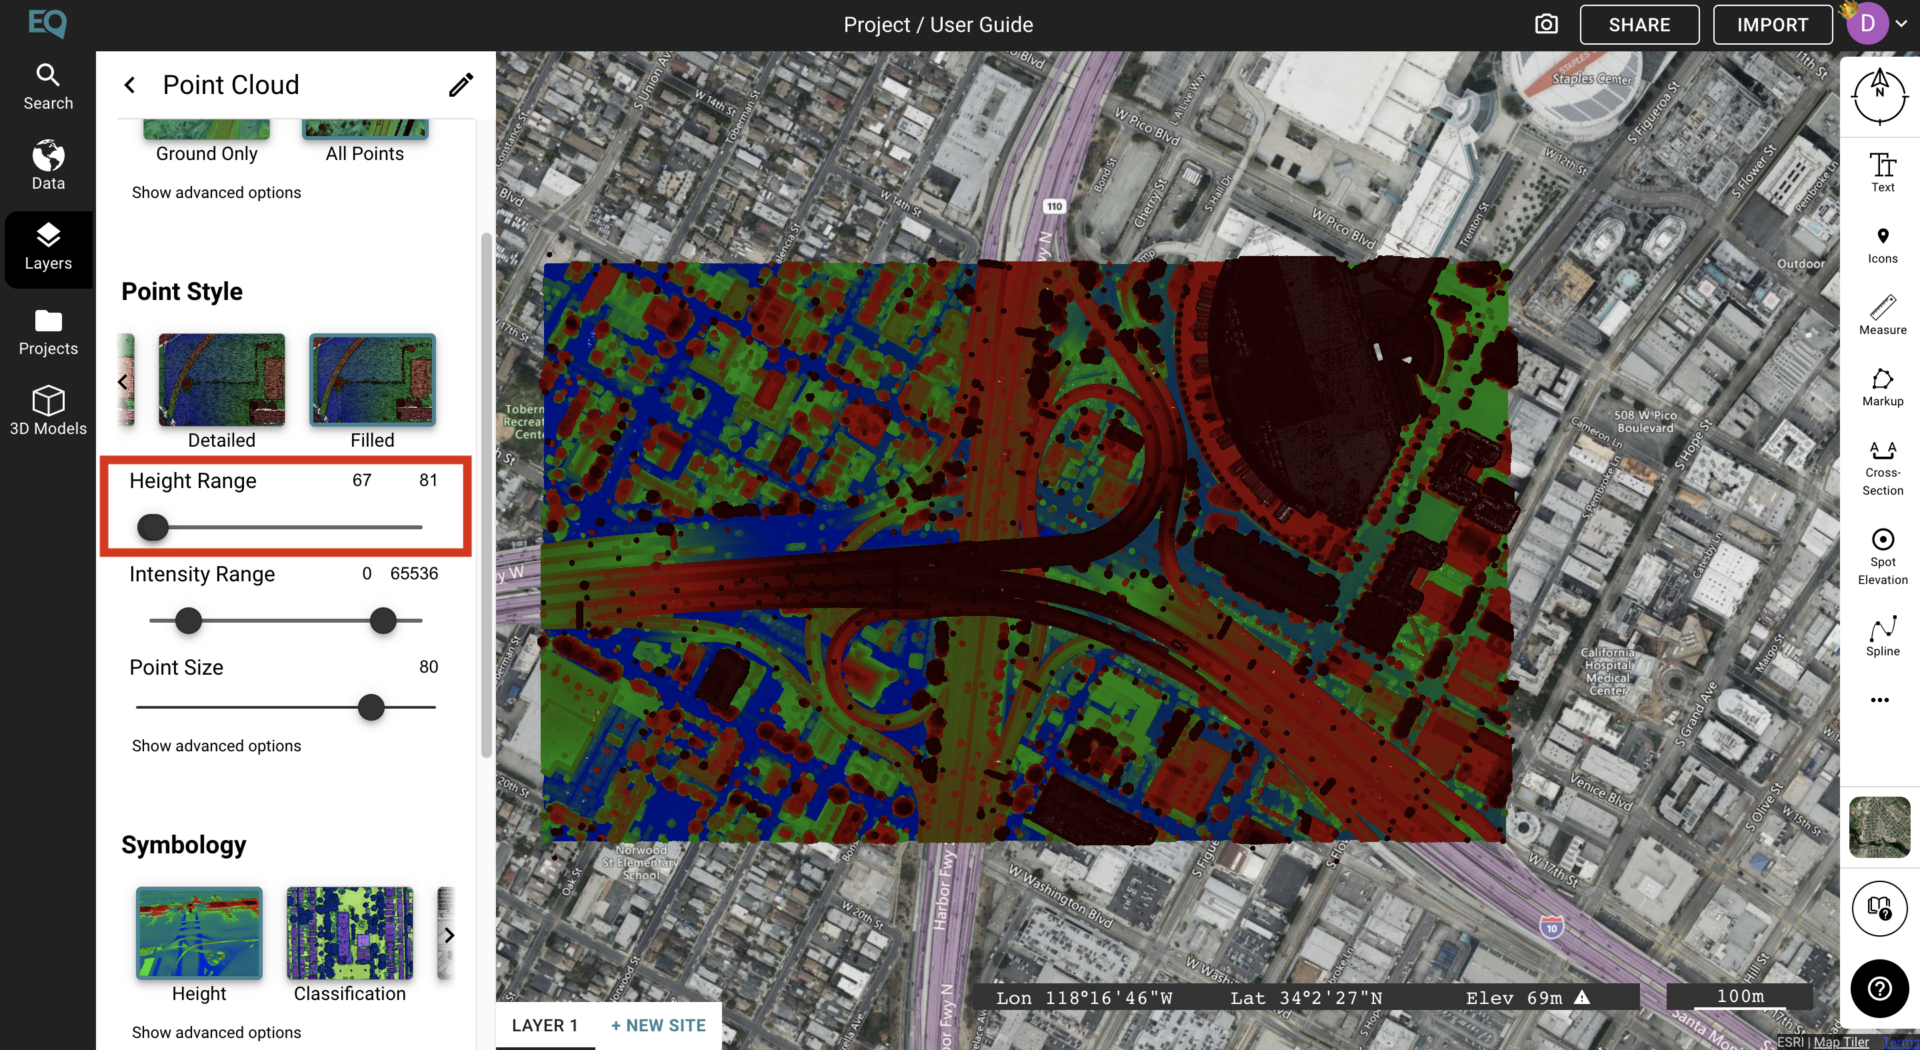
Additional options include:
- Intensity Range: The intensity range determines the intensity with which the data appears in the image. By decreasing the larger number in the intensity range, you decrease the intensity of the image.
- Point Size: As the image is composed of singular points to create an image, it is possible to increase the point size using the “Point Size” tool.
- Advanced Options: To view advanced options, click the “Show advanced options” button underneath the Point Style submenu. The “Shape” option allows you to change the shape of the points in the image. You can also change the attenuation of the image using the drop-down menu.
- Symbology: You can edit the symbology of the data by using the “Symbology” submenu. Here, you can choose between the “Height”, “Classification”, and “Intensity”. To view advanced options click the “Show advanced options” button. Within the advanced options, you can edit the Color, Height, Depth, Intensity and Classification of the data.
- Eye Dome Lighting: The “Eye Dome Lighting” feature allows for the integration of shadows and different lighting into the image.
To go back to the layers panel and continue editing, either click the arrow at the top of the “Point Cloud” menu, or click the “Layers” panel on the sidebar menu.
To view more options for each layer and sublayer, click the three dots to the right side.
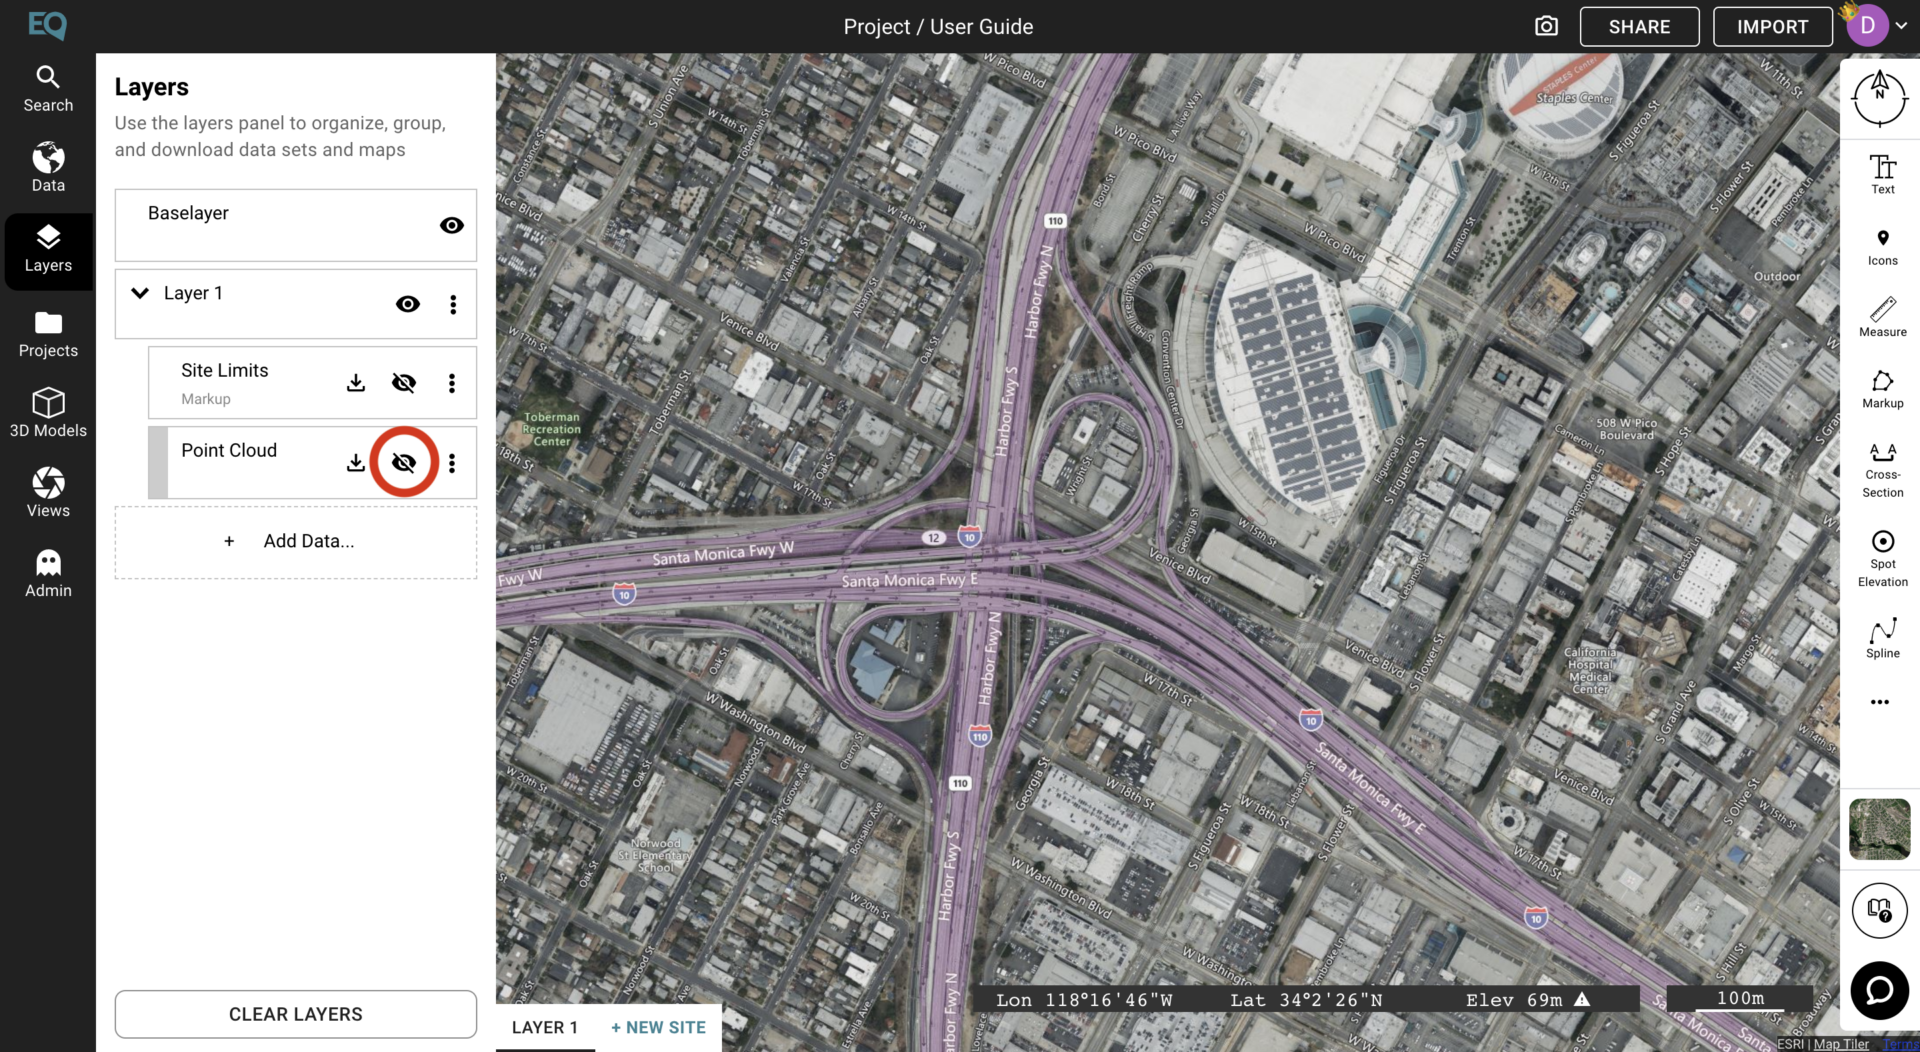
To change the visibility of the layer, click the eye button.
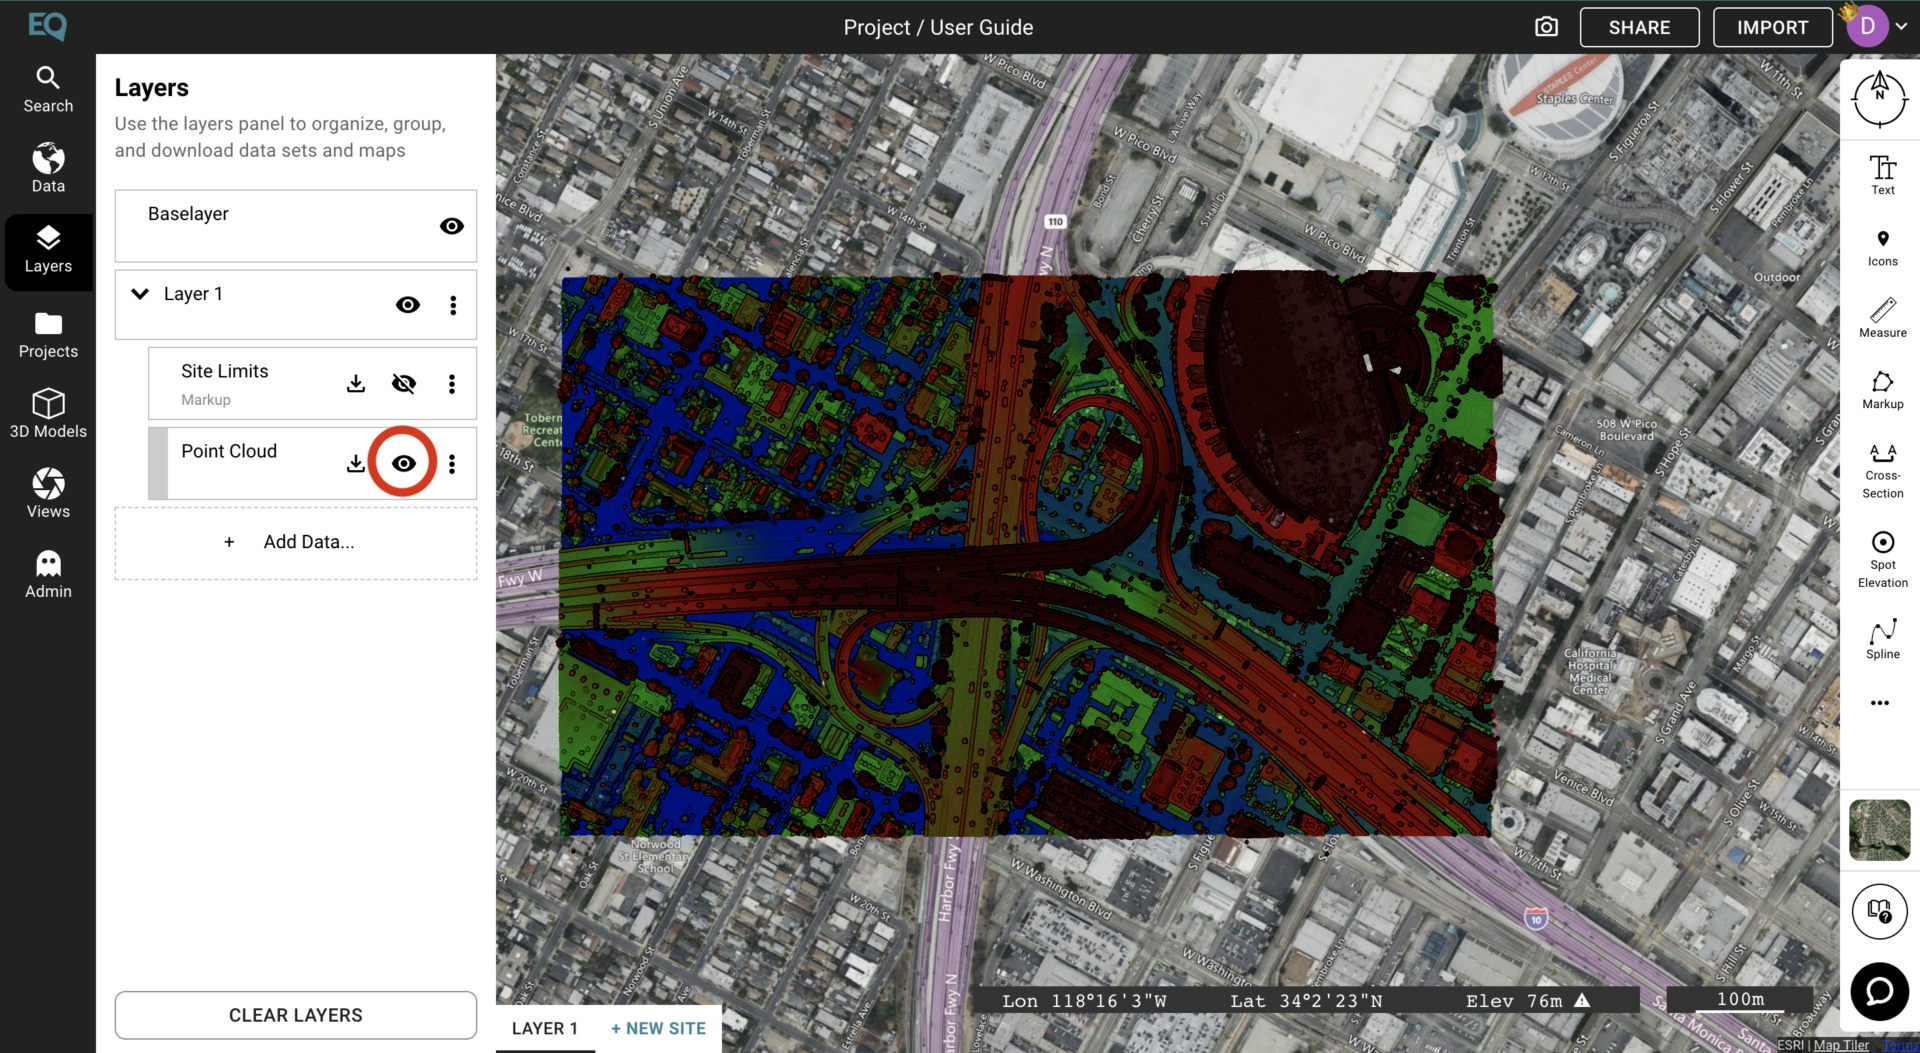
Once clicked, the layer will no longer be visible, and the eye icon will now appear to be crossed out.
