User Guide / Creating a report or figure
Creating a report or figure
In this tutorial, we will walk you through the following steps:
- Adding a report
- Editing the map space
- Editing the report space
- Exporting document
Guide
The report creation tool allows you to turn your work into a professional map for publishing.
Adding a report
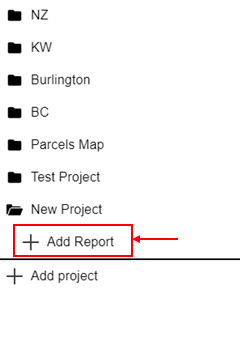
From your project folder menu, select Add Report below the project you have open.

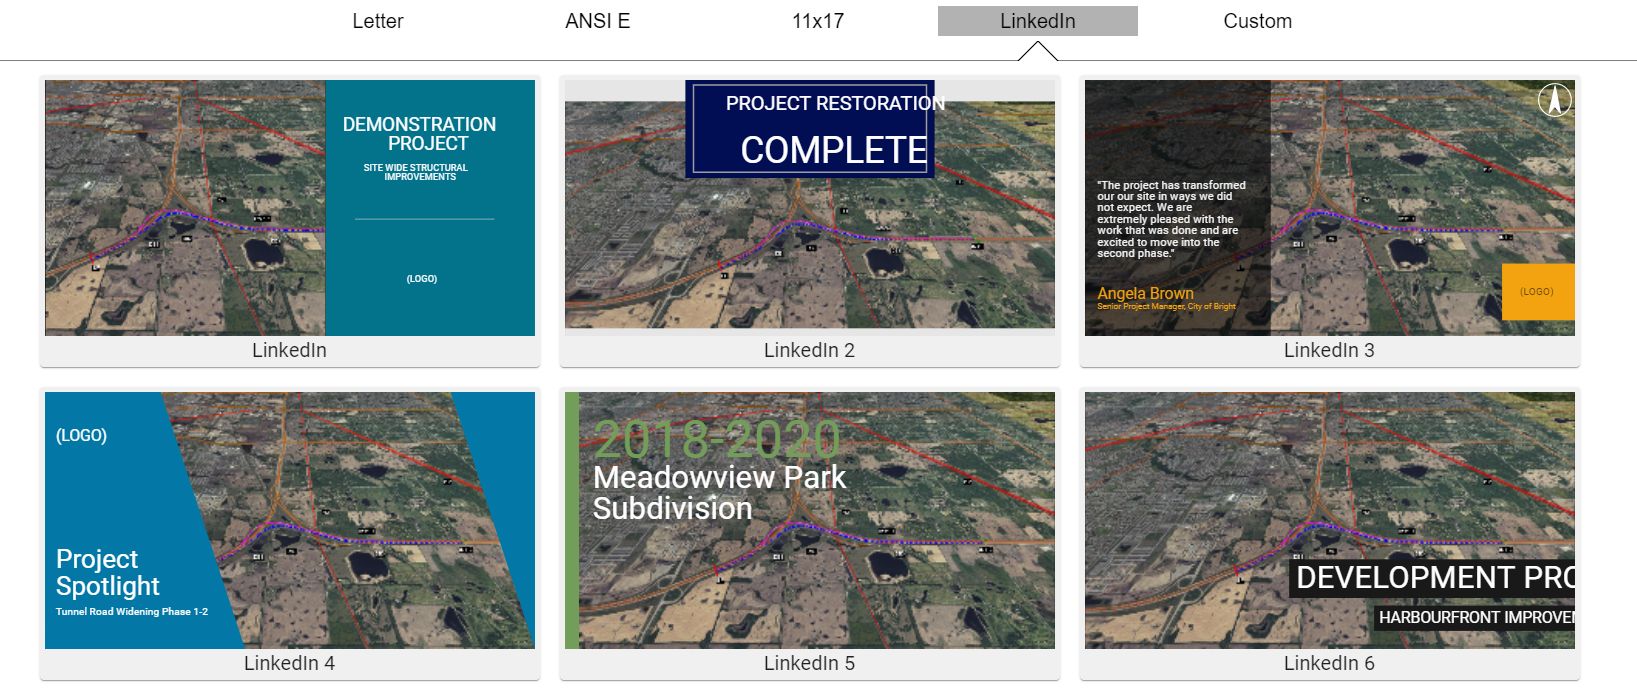
This will take you to the report creation menu. You now have a number of choices relating to your new report’s format and appearance. You can choose from a variety of templates and simply fill in the text boxes with your own relevant information, or you can choose “Blank” and start from scratch. You may also select your desired size: Letter, ANSI E, 11×17, LinkedIn, or Custom.

Editing the Map Space
In the report editor, there are two distinct spaces that have different controls associated with them. The Map Space is the frame that your map is displayed in on the report cover. The Report Space is all of the space on the report cover outside of the map space. Each of these two spaces can be customized for your needs.
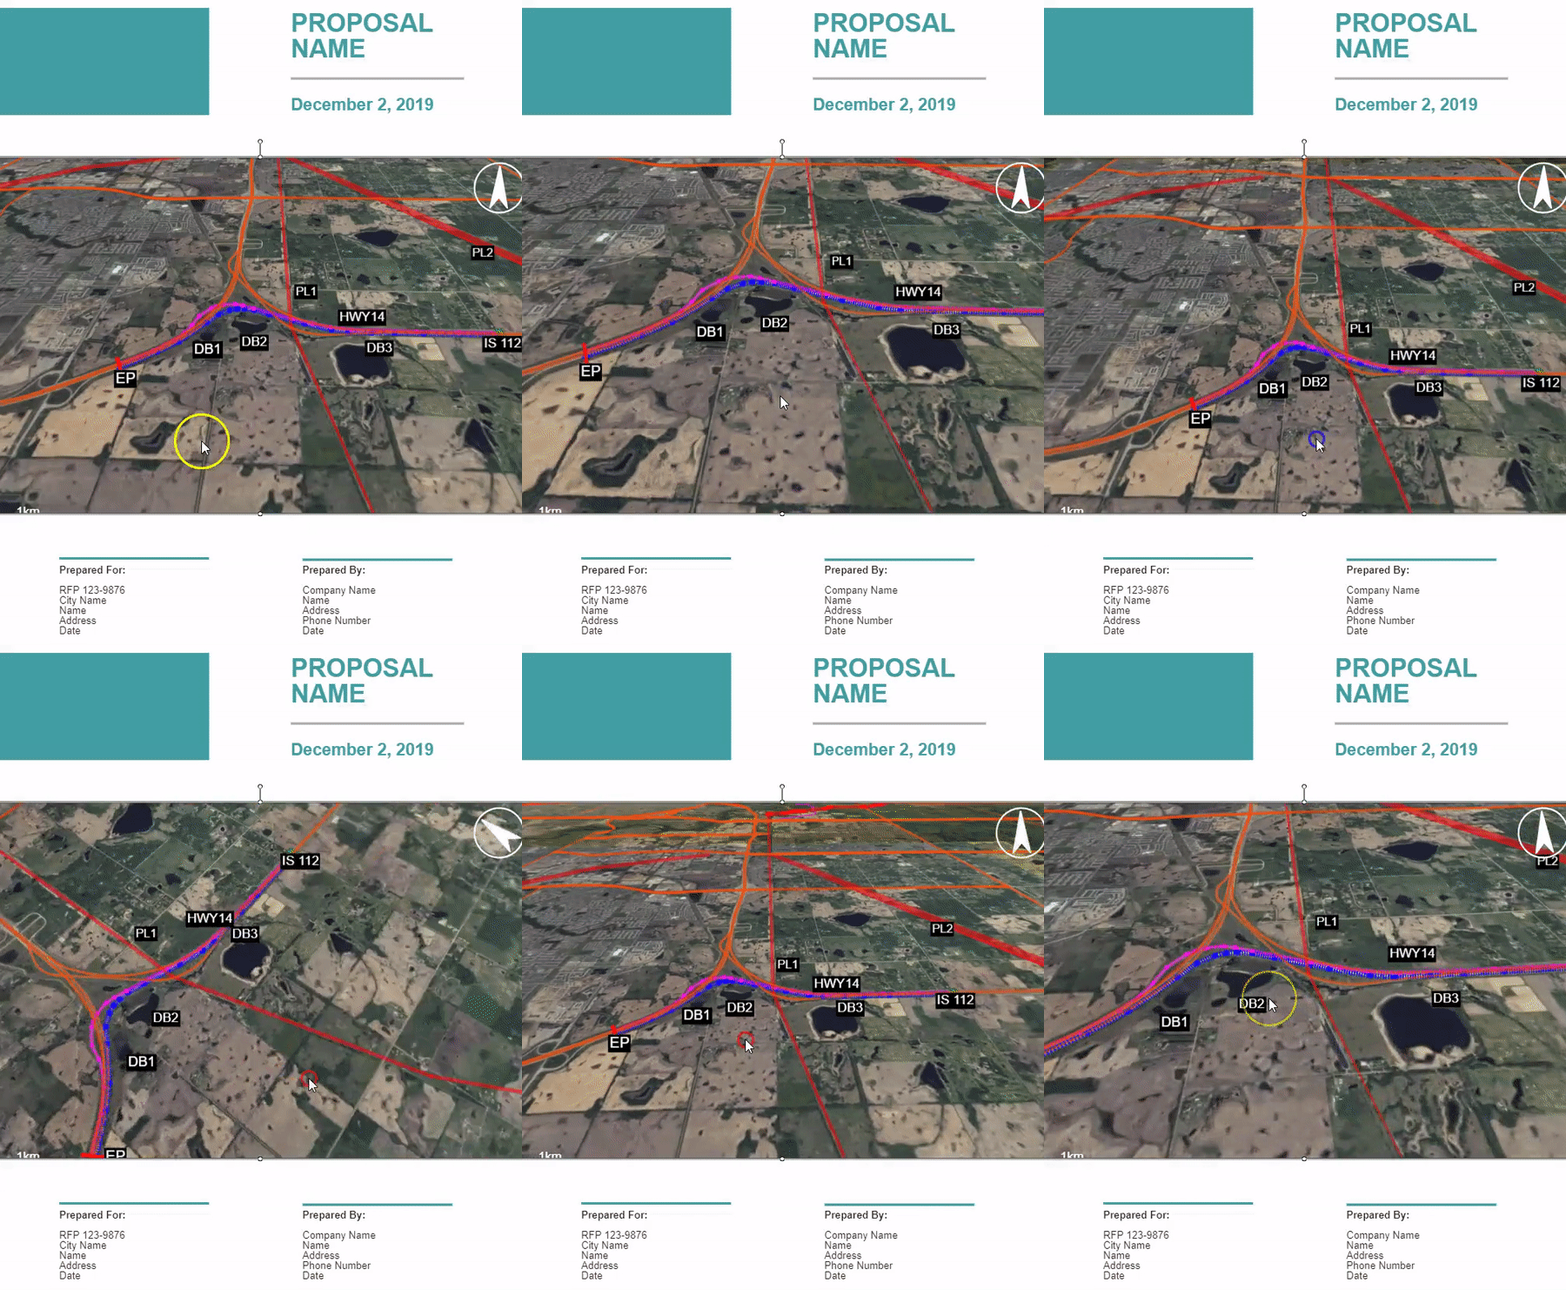
To adjust the map view, double click inside the map window and zoom and pan to reposition the scene.
The map view can be locked in the desired position to avoid accidental repositioning. This can be done by clicking into the map space, and then checking the Lock Map View box in the editor panel.
To adjust the size of the map view, single-click on the frame that you want to adjust. Use the stretch tools on the edges of the rectangle to click and drag the box to adjust to the desired size.
Multiple map views can be added to the same report page. To add an additional view, first click in the grey/negative space next to the report cover. In the editor panel on the right side of the screen, select Map View from the Elements section. Click and drag on your report page to draw a rectangle where you would like the new map view to appear.

Editing the Report Space
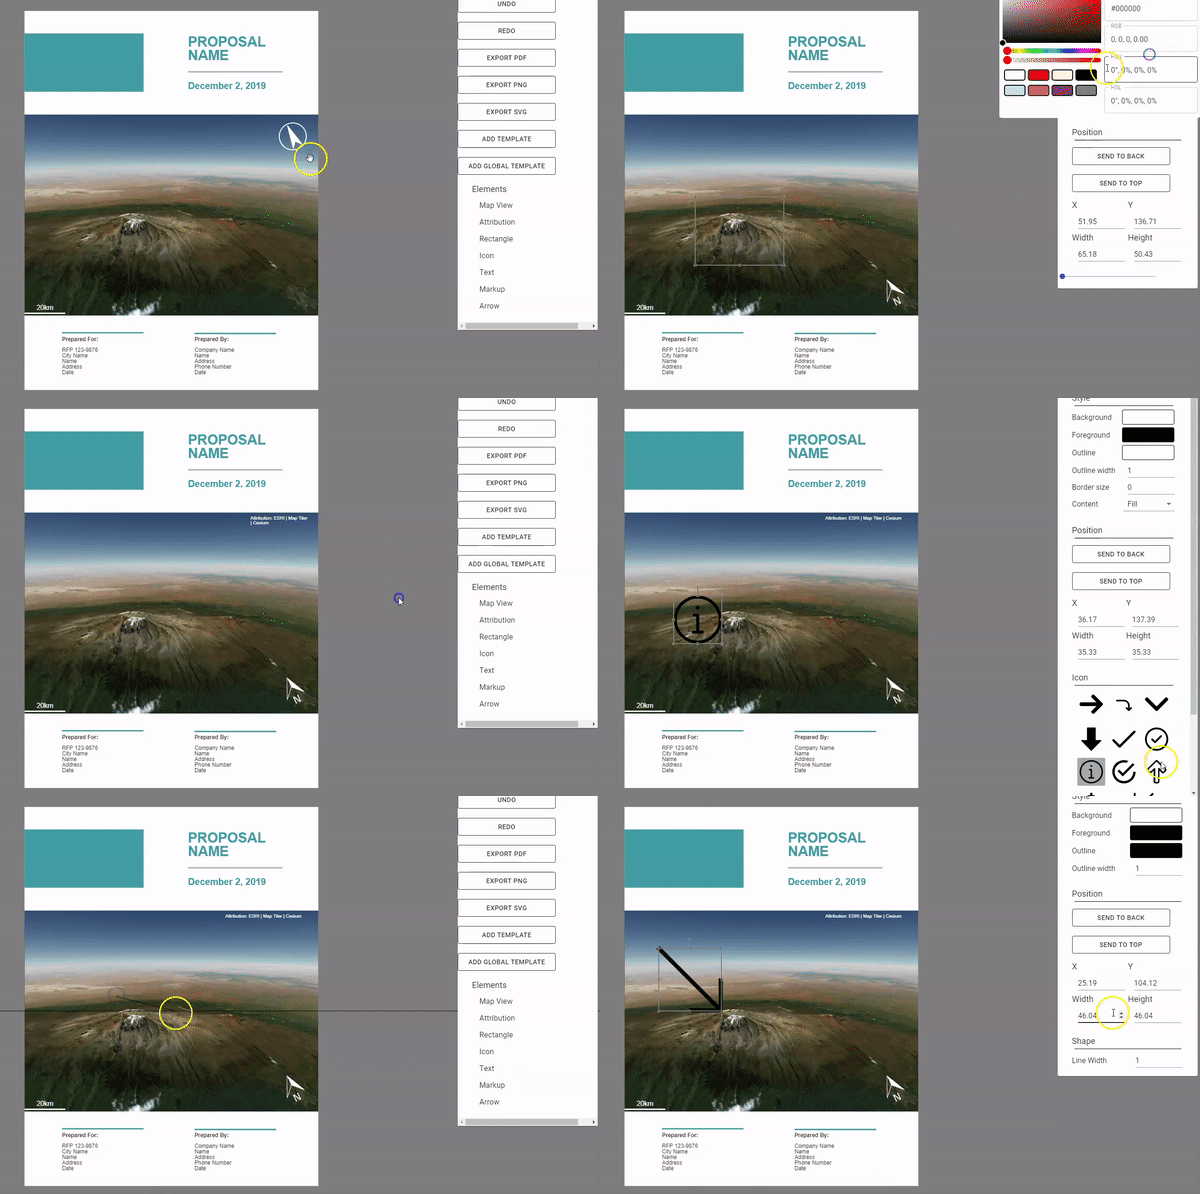
To bring the report editor toolbar into view, click anywhere on the report space or grey space.
Within the report editor, you can add and modify:
- Text blocks
- Colours
- Font
- Size and positioning of elements
- Symbols and north arrow
- Shapes
- Scale bar
- Legend
To add elements to the map under the Elements category in the report editor menu, you first select the element category, and then click and drag a box on your report or map. This will then bring the element options in to view on the right hand panel. Once you select your desired element and adjust the properties, you are able to resize and move this new element to suit your needs.

Exporting your document
To export your finished product, double click in the grey space outside of the map to return to the main report menu. Using the menu panel on the right side of the screen, select your desired export format.