Google Earth Contours vs LiDAR Contours
Introduction
Using contours to represent the topography of a site is one of the easiest ways to understand the ground surface conditions. Unfortunately, finding reliable contour data is not always as easy to come by.
This article includes a summary of two different methods of sourcing contours and how they compare. The methods tested in this article include:
- Google Earth + GPS Visualizer + QGIS (“The Google Earth Way”)
- Equator + USGS LiDAR Data (“The LiDAR Way”)
Follow along with the video or read the full article below.
Video Overview
The Google Earth Way
Part 1: Download Google Earth Pro and create points using the path tool
- Google Earth Pro is free and can be downloaded by visiting their website (look for “Google Earth Pro on desktop.”
- Navigate to your site in Google Earth, and then use the Path tool to draw (and create points) throughout your site.
- Once you have fully covered your site with the path tool, click ok. Export your path by right clicking on the layer in the left menu and save the file in kmz format.
While scribbling all over your site may seem like a wild way to generate contours, for many it has become a simple hack to extract important information. The key to this approach is creating as many points as possible on the site, to capture detail in the contours, so try to have fun while making a big mess.

Part 2: Add elevations to the points created in GPS Visualizer
At this point, the points created in Google Earth only have horizontal coordinates (x and y), no elevation.
We are going to use GPS Visualizer to add elevation to the points that we’ve created.
- Click on convert to GPX and upload your kmz file.
- Open up the Add DEM elevation data drop-down menu. This menu includes seven different options as show below.
- You can go ahead and select best available source so that, by default, the highest resolution elevation information will be added to your points.
- Click on Convert
- Download your gpx file.

Part 3: Add elevations to the points created in QGIS
At this point, you have a gpx file with coordinates – including the hoorizonal and vertical values.
The next step is to generate contours from the points. To do this, we will use QGIS, a free GIS software that you can download from their website. Once you have QGIS open, follow these steps:
- Add the gpx file to your project. In the top navigation bar, click on Layer > Add Layer > Add Vector Layer, select your file and then click Add
- Select the layer called “track_points” or whatever layer has the greatest number of features in it (hint, these are your points). At this point, you should see all of the points created using Google Earth and GPS Visualizer on your screen.
- Next, turn the points into contours. In the top navigation bar, click on Vector > Contour. Make the following parameter adjustments:
- Data value drop down needs to be set to elevation or “ele”
- Method drop down: Fixed contour interval
- Interval: Your choice, I selected 0.5 m
- Number: You will likely have to tweak this until you get the desired result.
- Click Add. At this point, you should have your contours created which can be download in any format!

The LiDAR Way
Part 1: Generate Contours from LiDAR in Equator
- Navigate to Equator
- Find your site using location search
- Open the Site Builder menu
- Add a new site and select your site bounds
- Select Contours from the left menu
- Determine if you need smooth or detail contours
- Select an output contour interval
- Click Generate
When you click generate, Equator creates contours from the best-available public lidar data. This data is generally accurate between 5 and 30 cm (vertically).

Google Earth vs LiDAR Contour Comparison
Visual Comparison
From a visual comparison perspective, we can see that the contours are similar in flat areas – in the open fields, along gentle slopes. In areas where there are abrupt elevation changes, it is clear that the 30 m resolution contours generated the Google Earth way are extremely insufficient – along the roadways, along the creek and in the drainage channels. The contours created from the USGS lidar data are much more representative of the actual features on the ground.
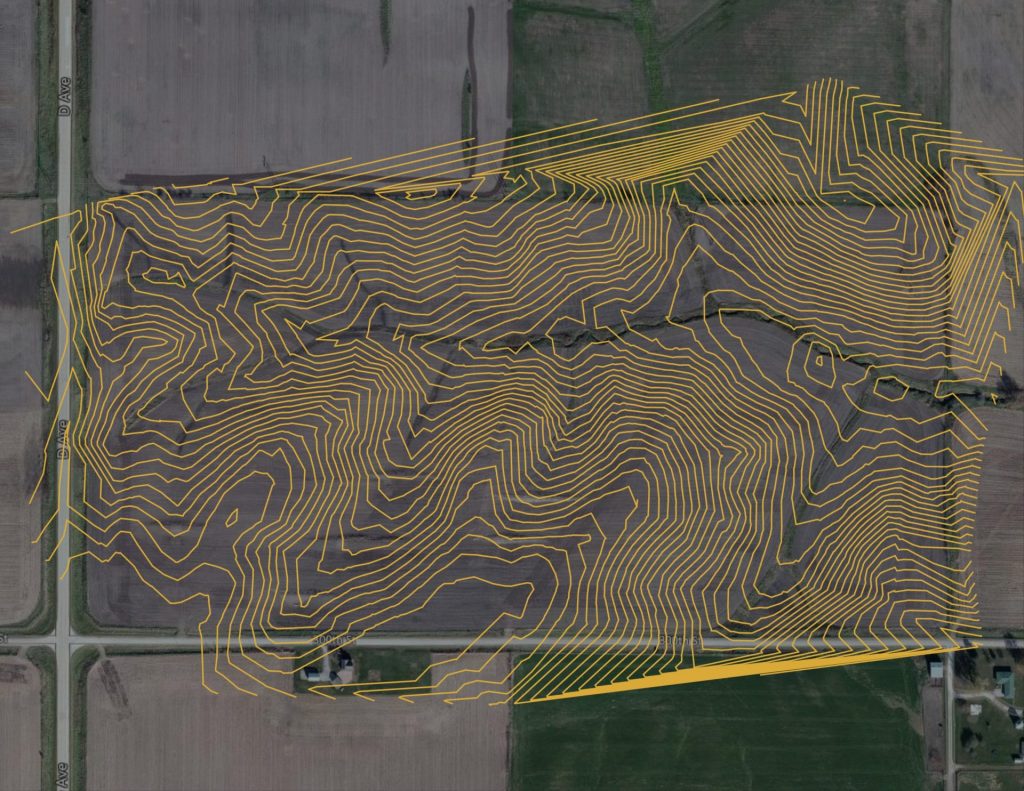

Contours generated “The Google Earth Way” (left) versus contours generated from lidar (right)
Detailed Cross Section Comparison
Cross-sections were cut along the road and swale. In the first graph, the lidar cross sections are extremely detailed and include the crown of the road, and ditches along either side. Similarly, the swale includes much more definition. The difference between the two elevation data sets is as great as 0.6 m, or 2 feet.

Try it Yourself
If you want to try generating contours using Equator and built-in lidar data, click the link below. Equator currently includes built-in lidar data for the majority of the US, and portions of Canada and New Zealand.