How Contour Maps are used in Permaculture
In this short article you will learn about Permaculture, as well as how Contour Lines can help in the interpretation of different landscapes.
What is Permaculture?
 Permaculture is creating sustainable systems through the integration of different resources. It is a land design approach that creates no waste by imitating the sustainable and natural systems. “It is a multidisciplinary toolbox including agriculture, water harvesting and hydrology, energy, natural building, forestry, waste management, animal systems, aquaculture, appropriate technology, economics and community development”.
What is a Contour Line, and Why is Contour Mapping Important in Permaculture?
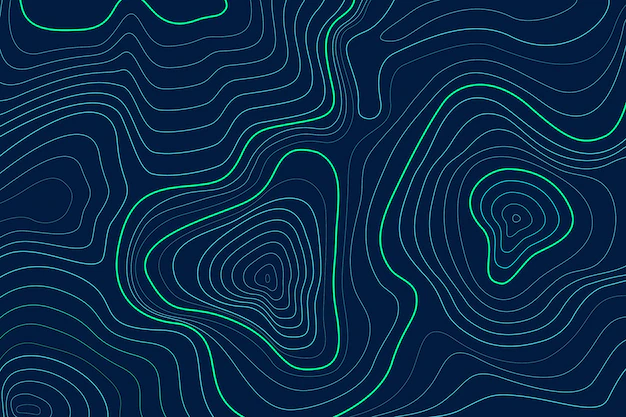
Contour lines illustrate changes in elevation and natural features. They connect points of equal elevation above sea level, to create a visual representation of the terrain’s shape and relief. Contour lines give us a proper understanding of the layout of an area, allowing us to map out the most efficient and effective design.
What is a Permaculture Swale?
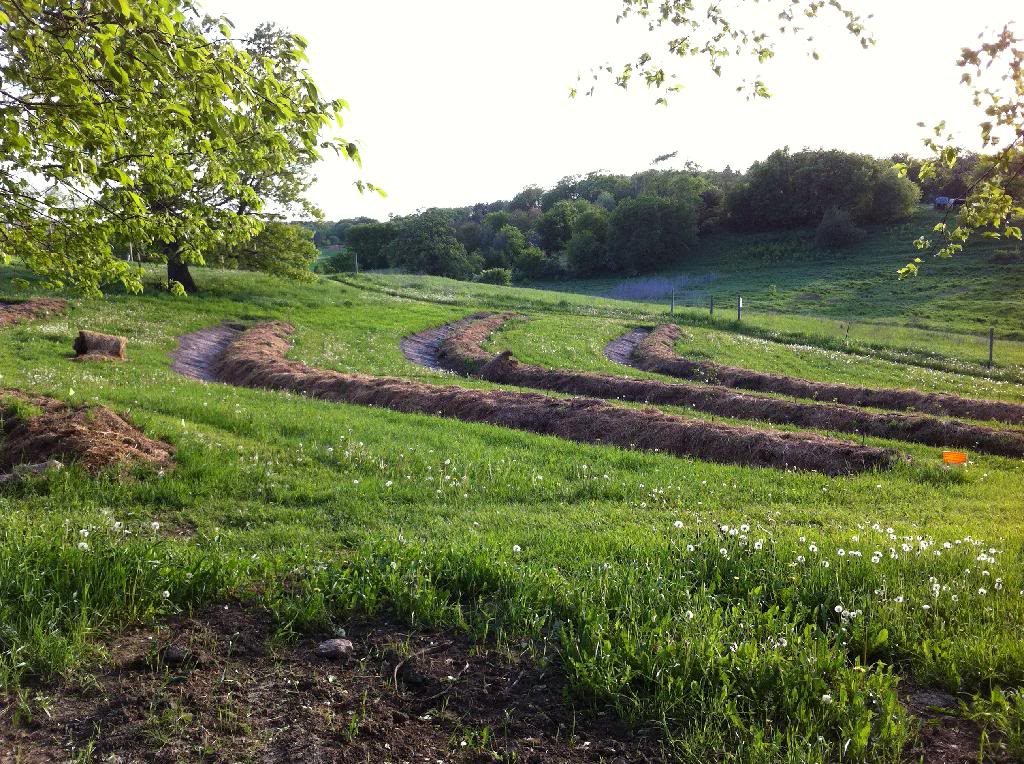 Swales are used to collect water and slow down surface flow, which prevents or reduces erosion on certain parts of the land. Swales are built on the contours of landscapes. They are dug lower than other ditches in the area to allow for the water to flow and collect into one area. Swales can also be used to move water across a landscape, as well as hydrate landscapes.
How do you Make a Contour Map?
In Equator, it is easy to view contours and make a contour map. The tutorial below goes through exactly how to do that.
Open Equator, log in or create a new account. Search for your project location using the Search toolbar. Once you have chosen an area where you would like to create a contour map, click the “New Site” button in the bottom left hand corner.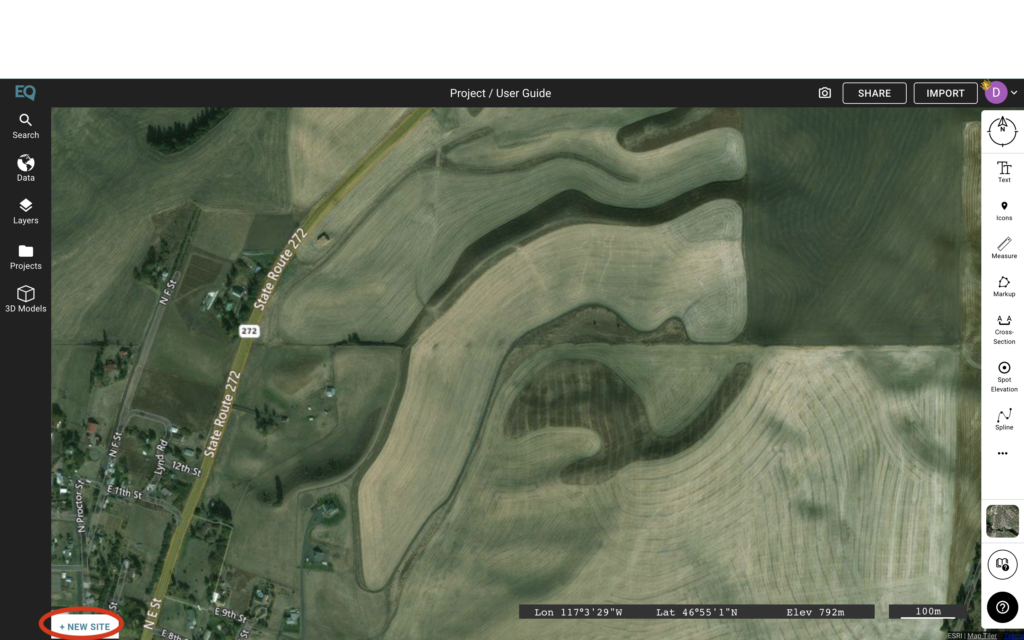
Once the site has shown up, check to make sure the area that you would like to capture is within the white boundary. If it isn’t, you can change the default boundary or create your own boundary. When you are happy with the boundary, click the blue “Okay” button.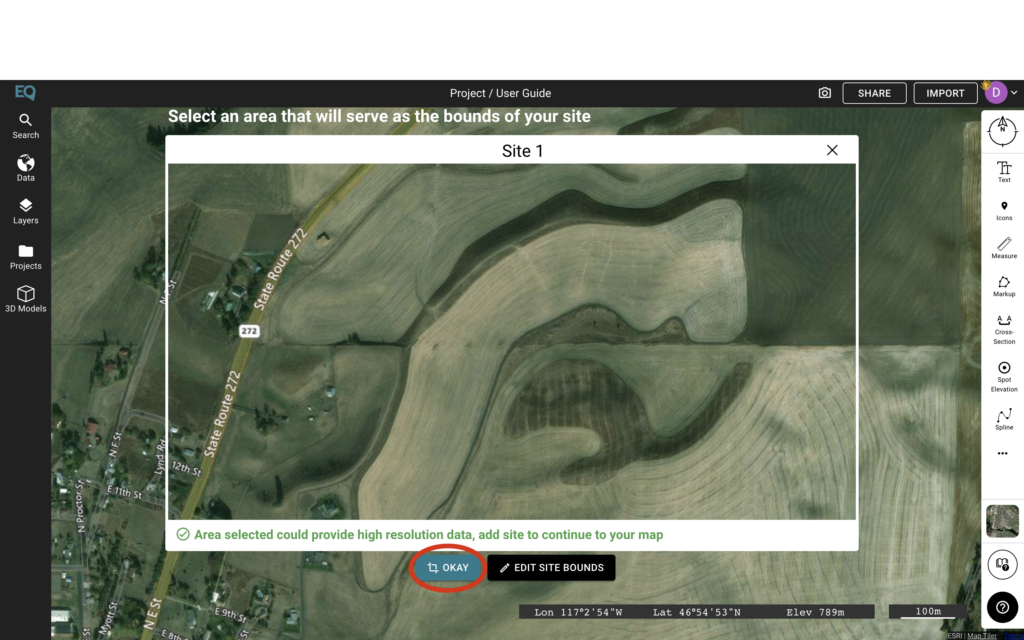
Once this is done, a white site boundary will appear. The Data panel will also open, allowing you to pick the type of contour data that you would like to load onto the site. You can choose contours as a shapefile (.shp) or contours as a drawing file (.dwg).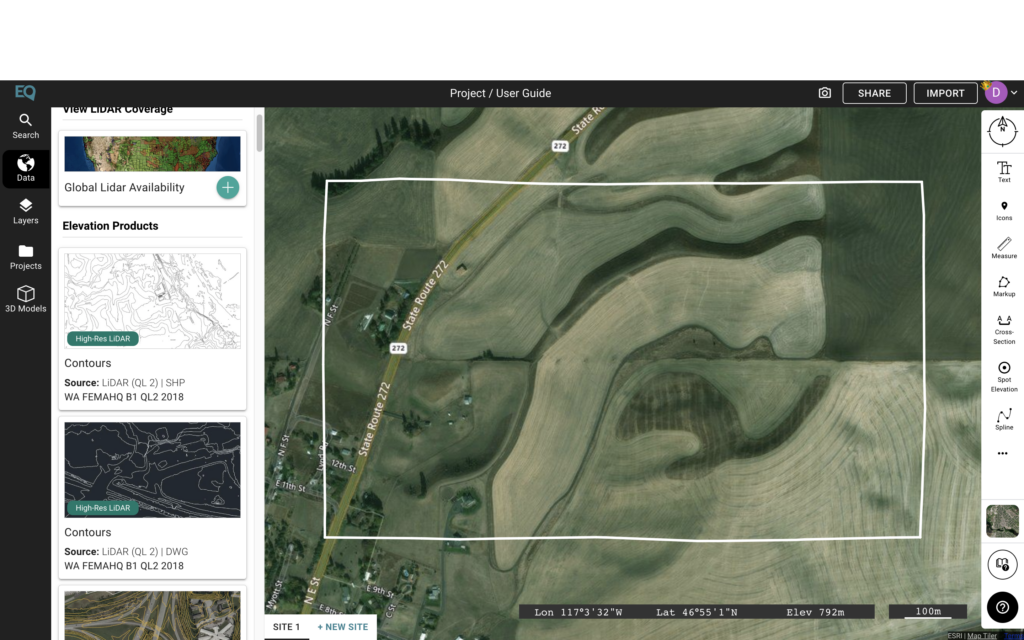
Once you have chosen the contour data that you wish to load onto the site, click the blue “+” button that appears once you hover over the data choice.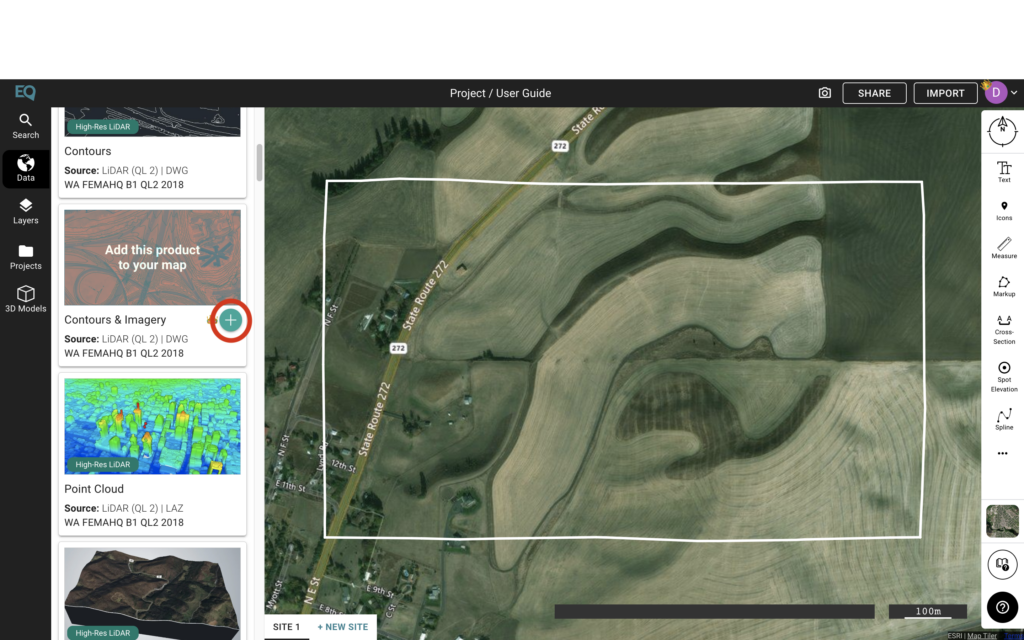
A screen with the option to customize the contours will appear. Here, you can choose between a Smooth, Detailed and Custom contour data upload. This allows you to pick how detailed and at what interval your contour lines will appear. Smooth is the default and will be used for this explanation. Click the “Generate” button to generate the contour data.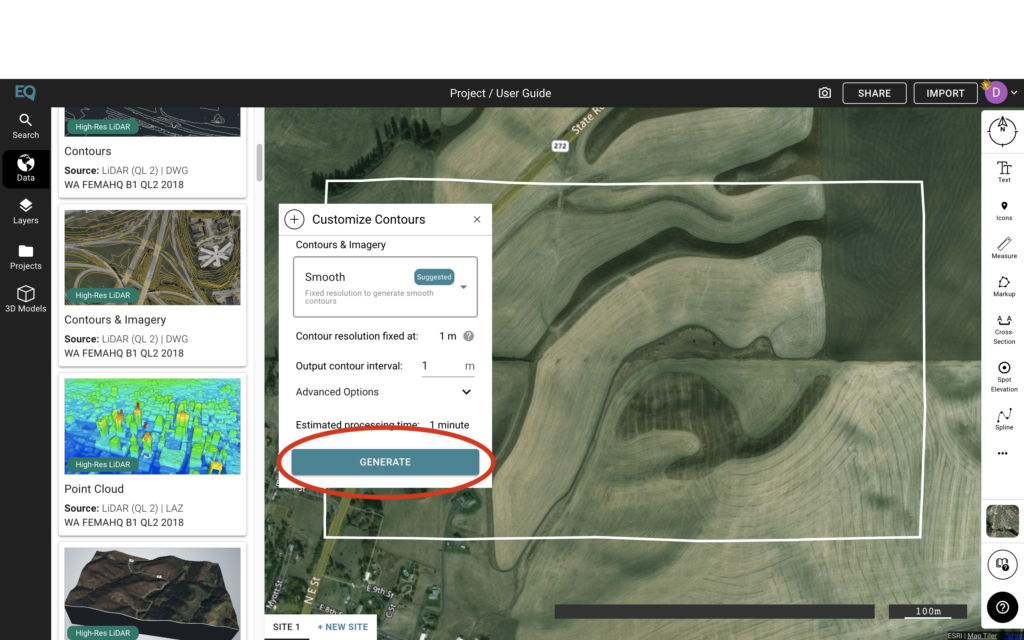
Once this is done, the progress will be shown in the upper hand corner. To view a more detailed version you can click on the button.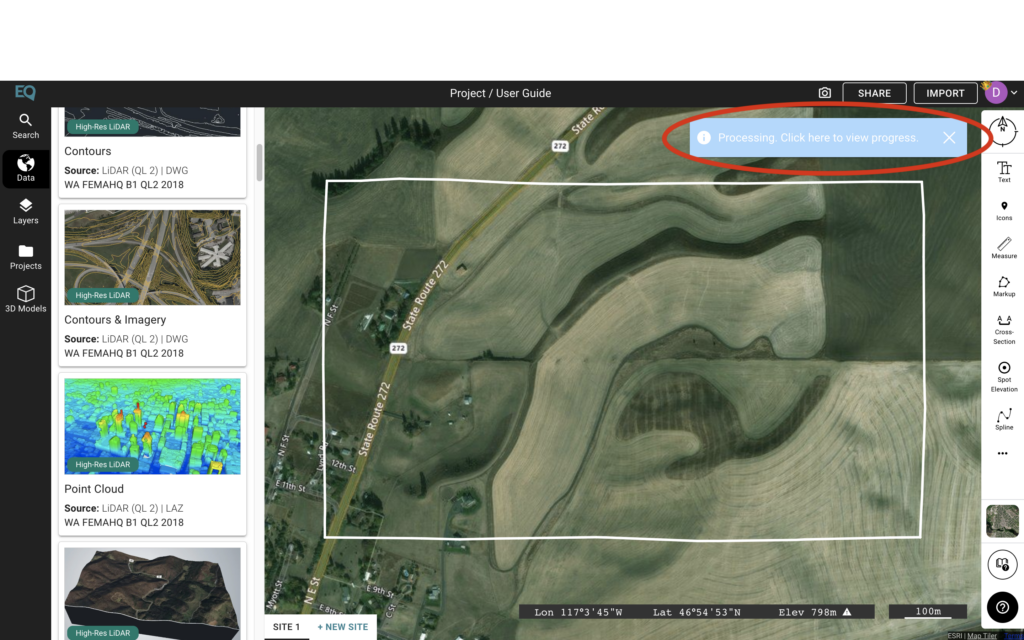
Once the data has been loaded, the contour lines will appear. In order to view and edit the contour mapping, click on the “Layers” panel.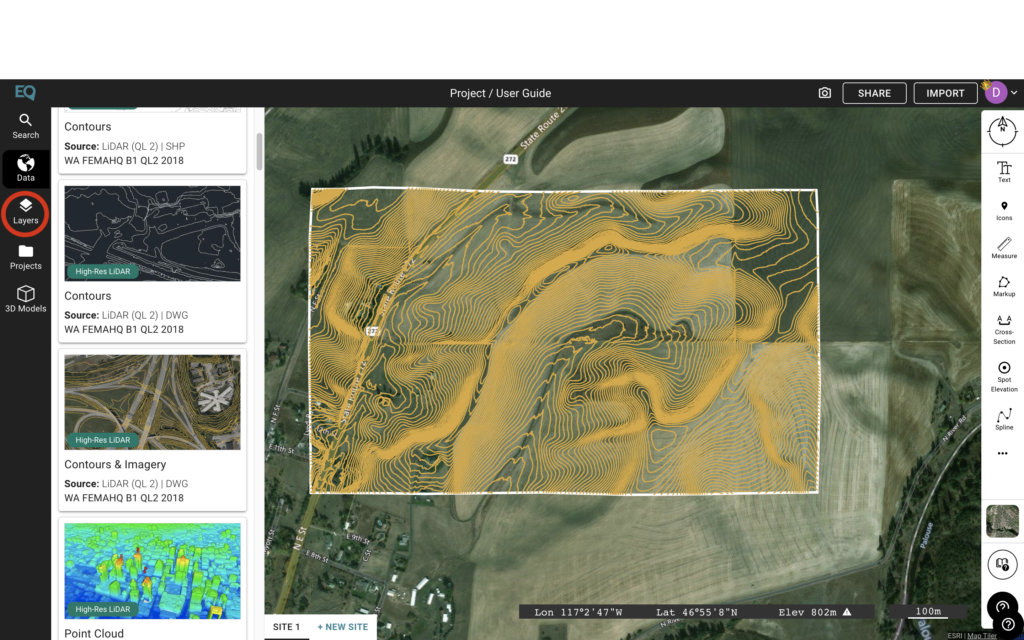
Once here, you will be able to view the layers that have been added to your project thus far. The contour mapping can be edited by double-clicking on the “Contours” sub-layer.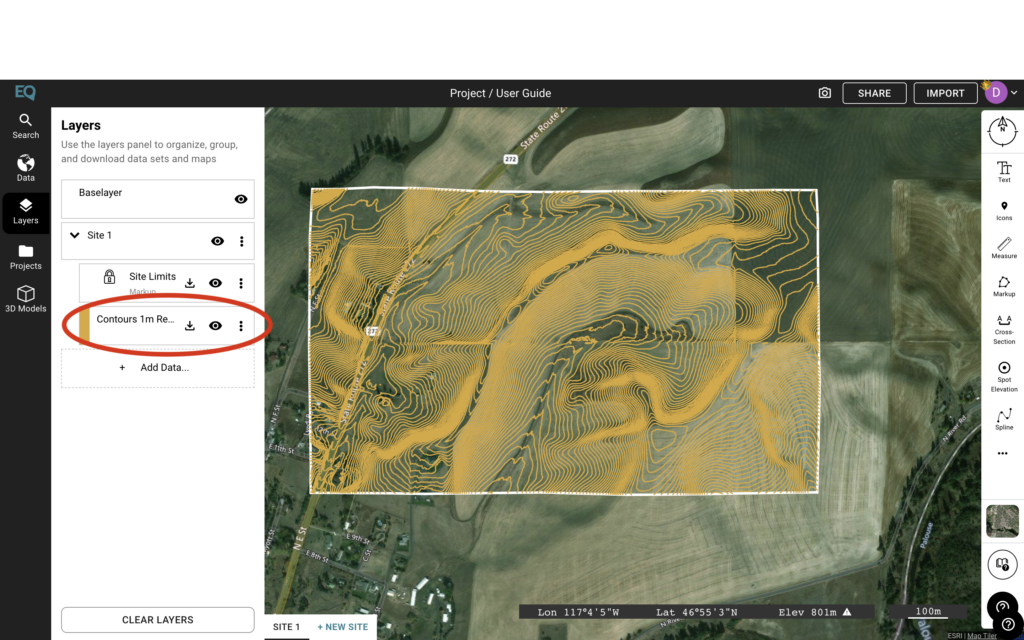
Here, you can edit the colour, thickness, and smoothing of the contour lines.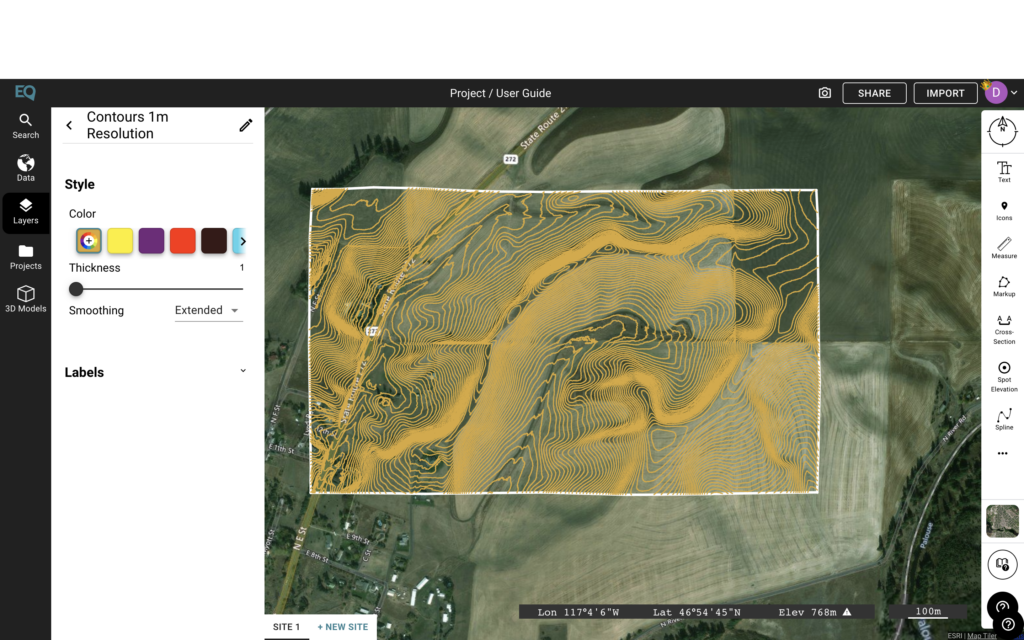
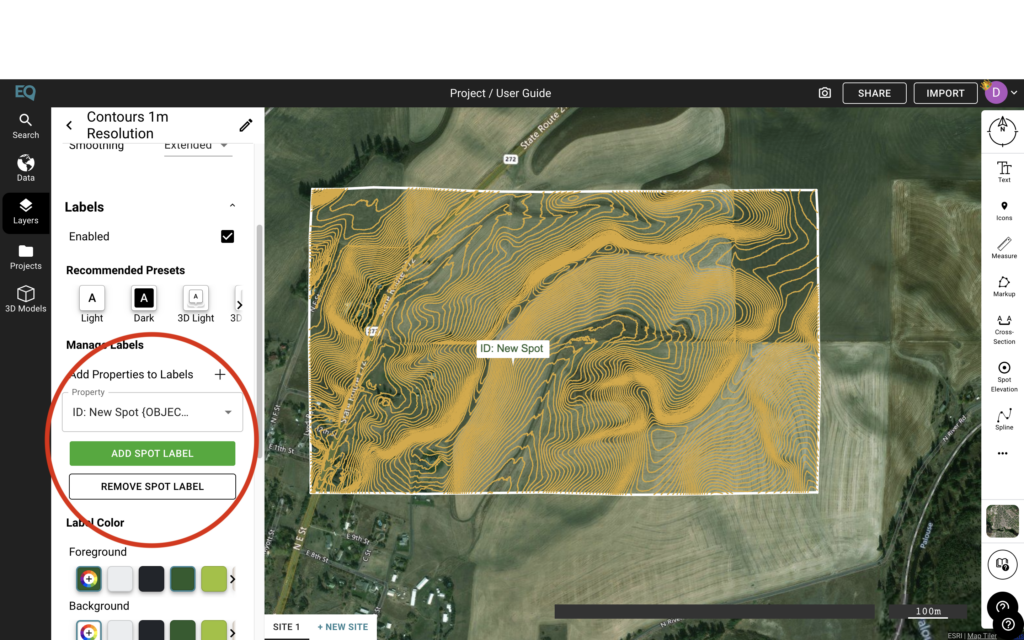
The “Labels” sub-menu can also be opened by clicking on the dropdown menu and checking in the box that reads “Enabled”.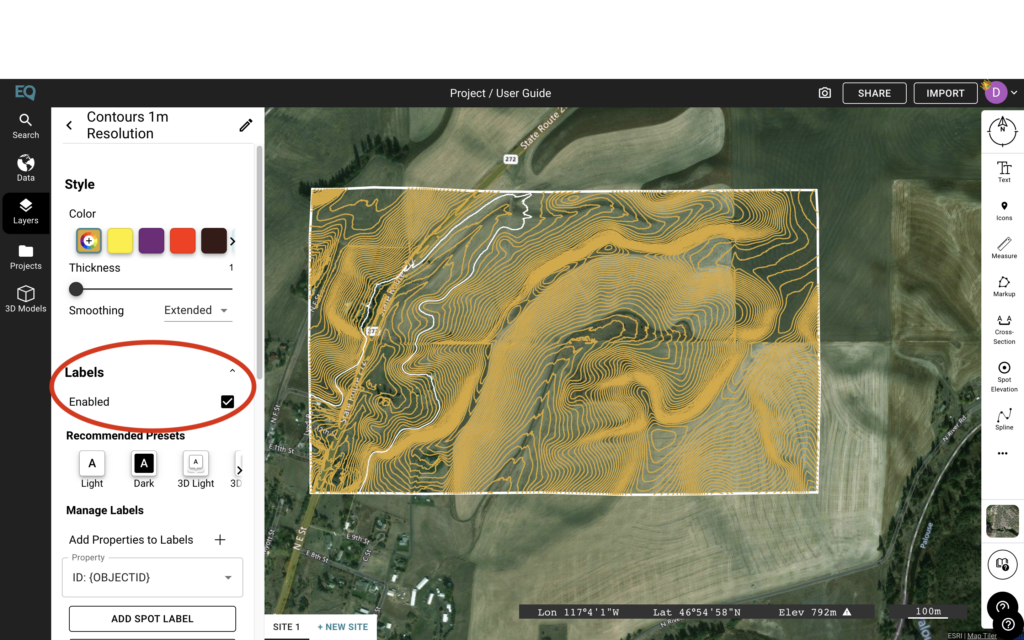
To add a label, click the “Add Spot Label” button. You can then place the label anywhere within the boundary to mark important spots. To edit the name of the label, click on the “Property” square, and edit. The colour of the label can also be edited using the features listed further down in the menu.