Step 1
Gather Your Data
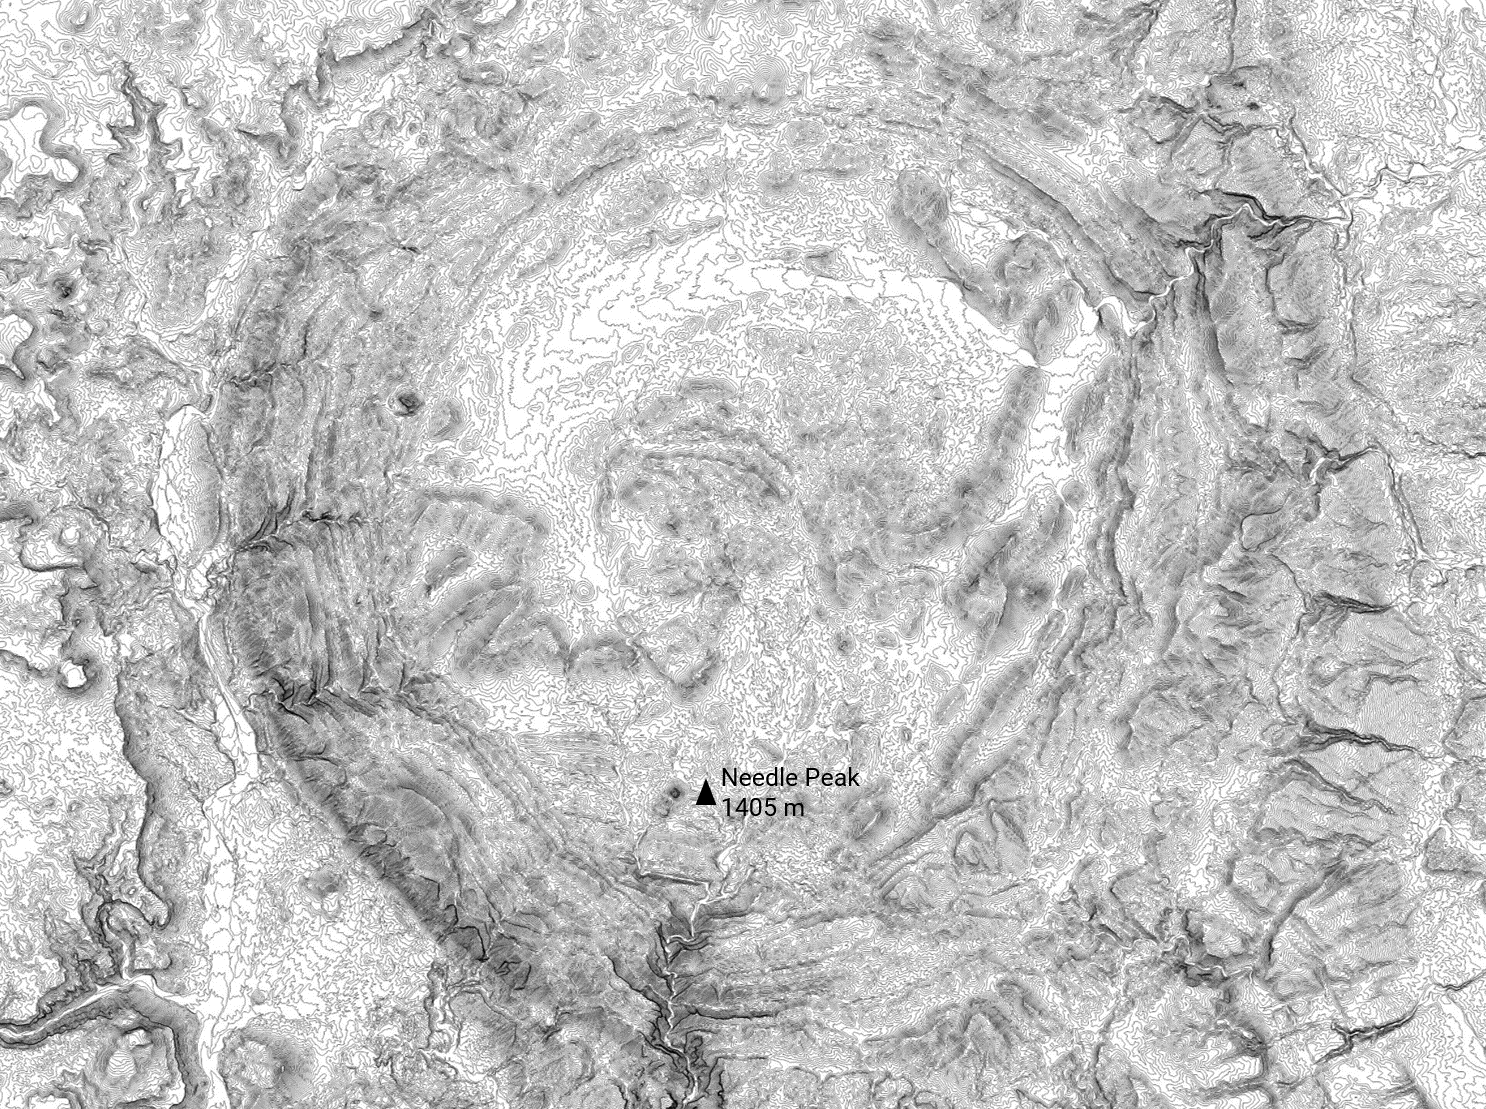
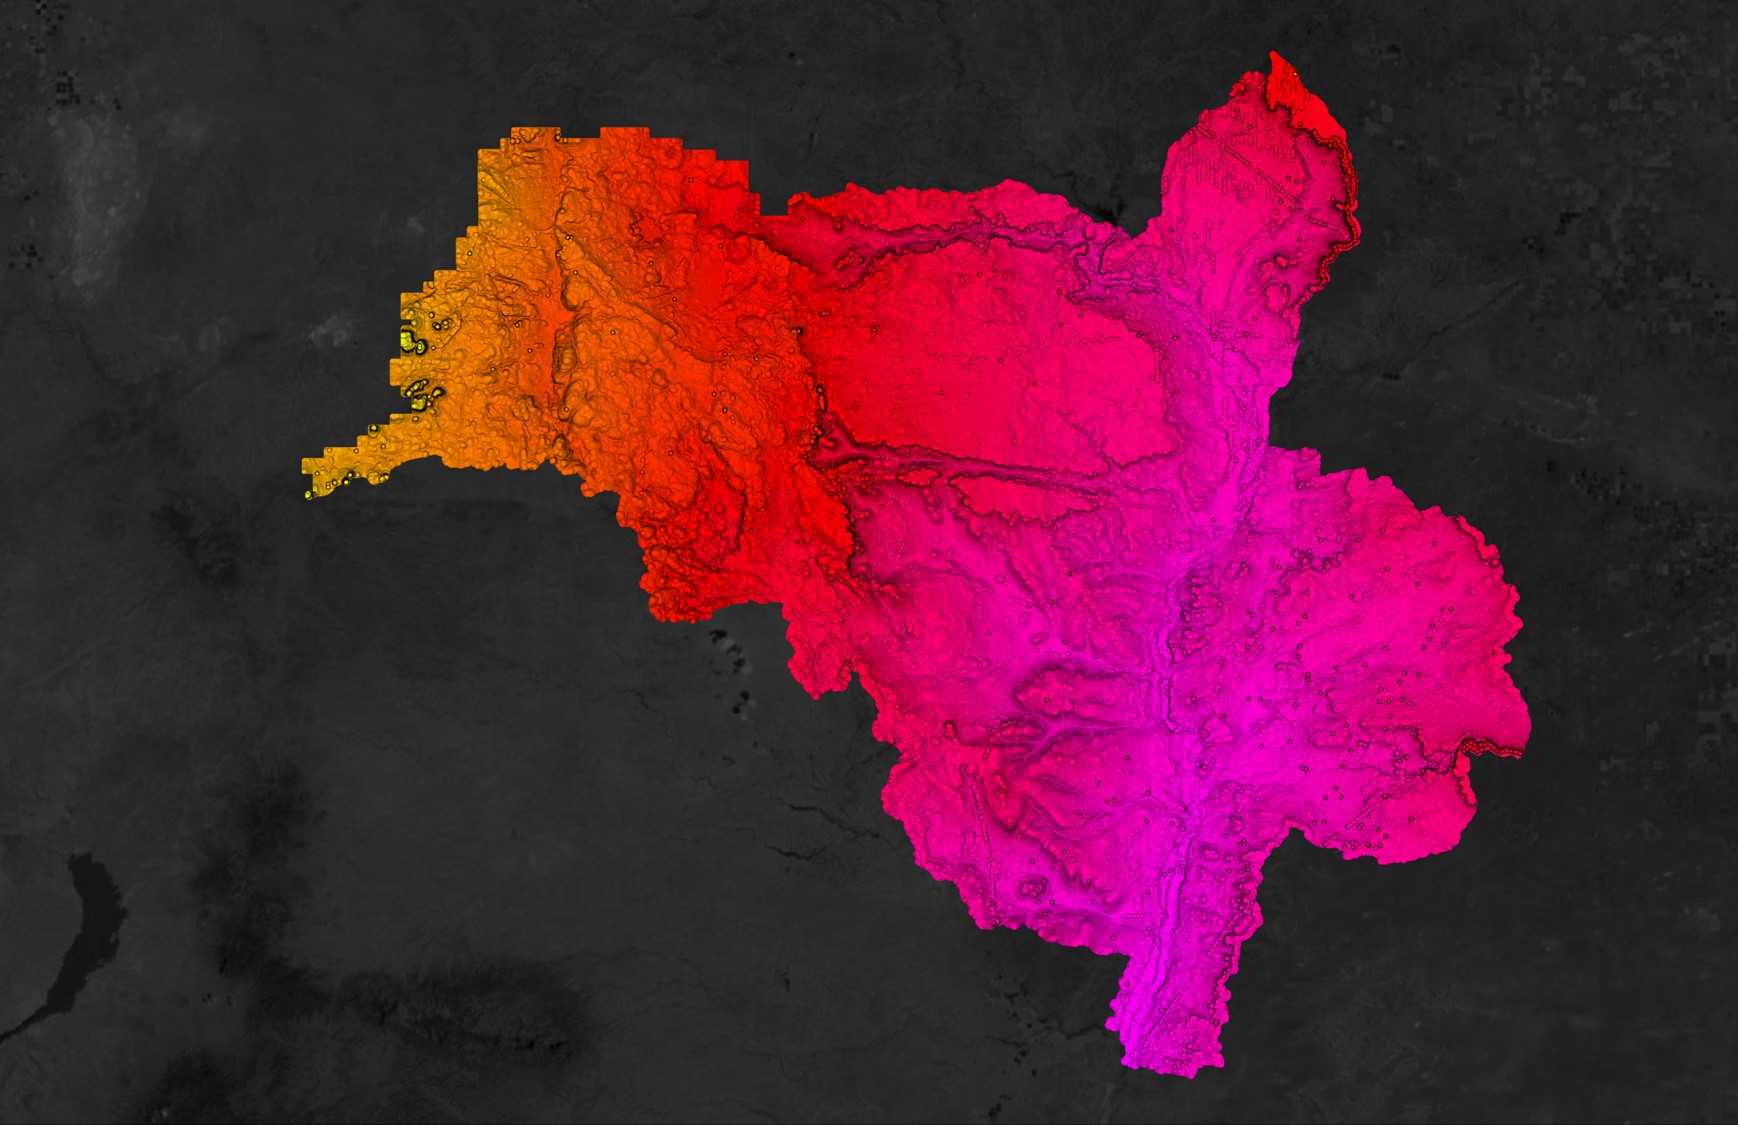
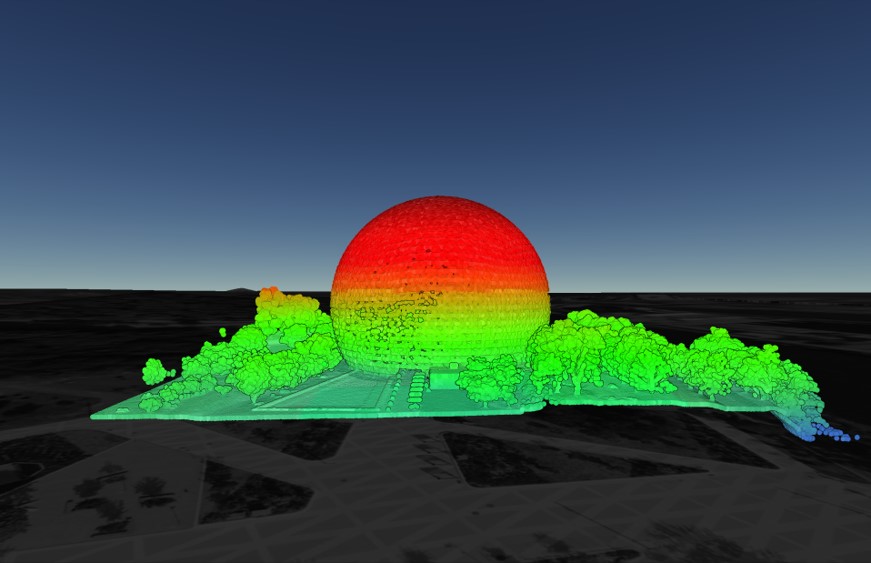
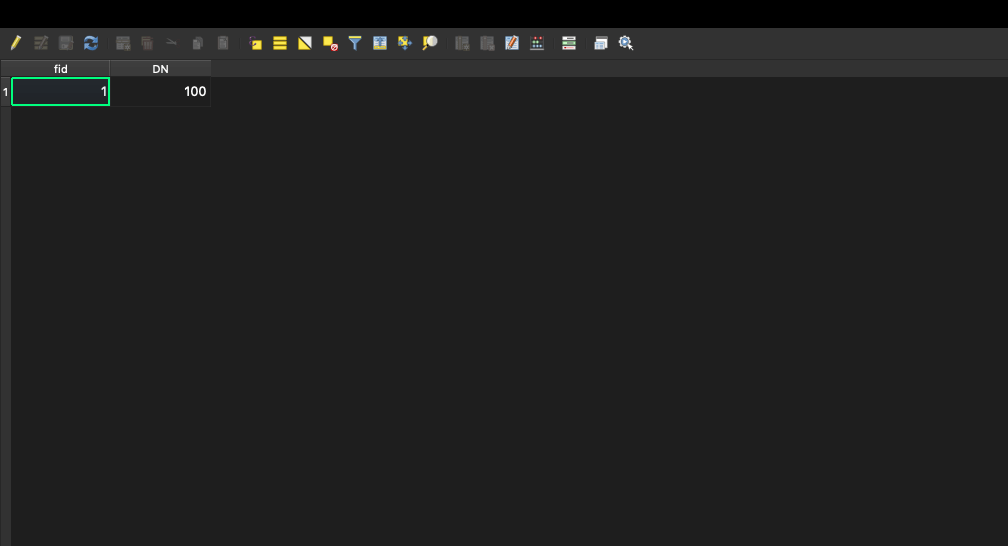
There is more than one way to acquire zonal statistics, with each method differing in some of the data required to execute the necessary processing tools. In our case, we will be using the Zonal Statistics tool which will require a polygon and raster layer. The polygon layer for our project will be our catchment/watershed boundary (region bordered in black) and the DEM of our region (extracted from the Equator Site Builder).
If you want to create a watershed like the one we made, you can follow through the following tutorial:
How to Delineate a Watershed in QGIS
Once you have these two polygon and raster layers, we can generate our Zonal statistics.

Gathered Data in QGIS
Step 2
Calculate Zonal Statistics
Now we can generate the statistics using the Zonal Statistics tool:
Processing Toolbox → Raster Analysis → Zonal Statistics
Input your raster layer in the Raster layer parameter as well as your vector layer in the Vector layer containing zones parameter. Next, in the Statistics to calculate parameter, select the stats you want to generate (this will vary in accordance to your project). Once this is complete, run the tool.
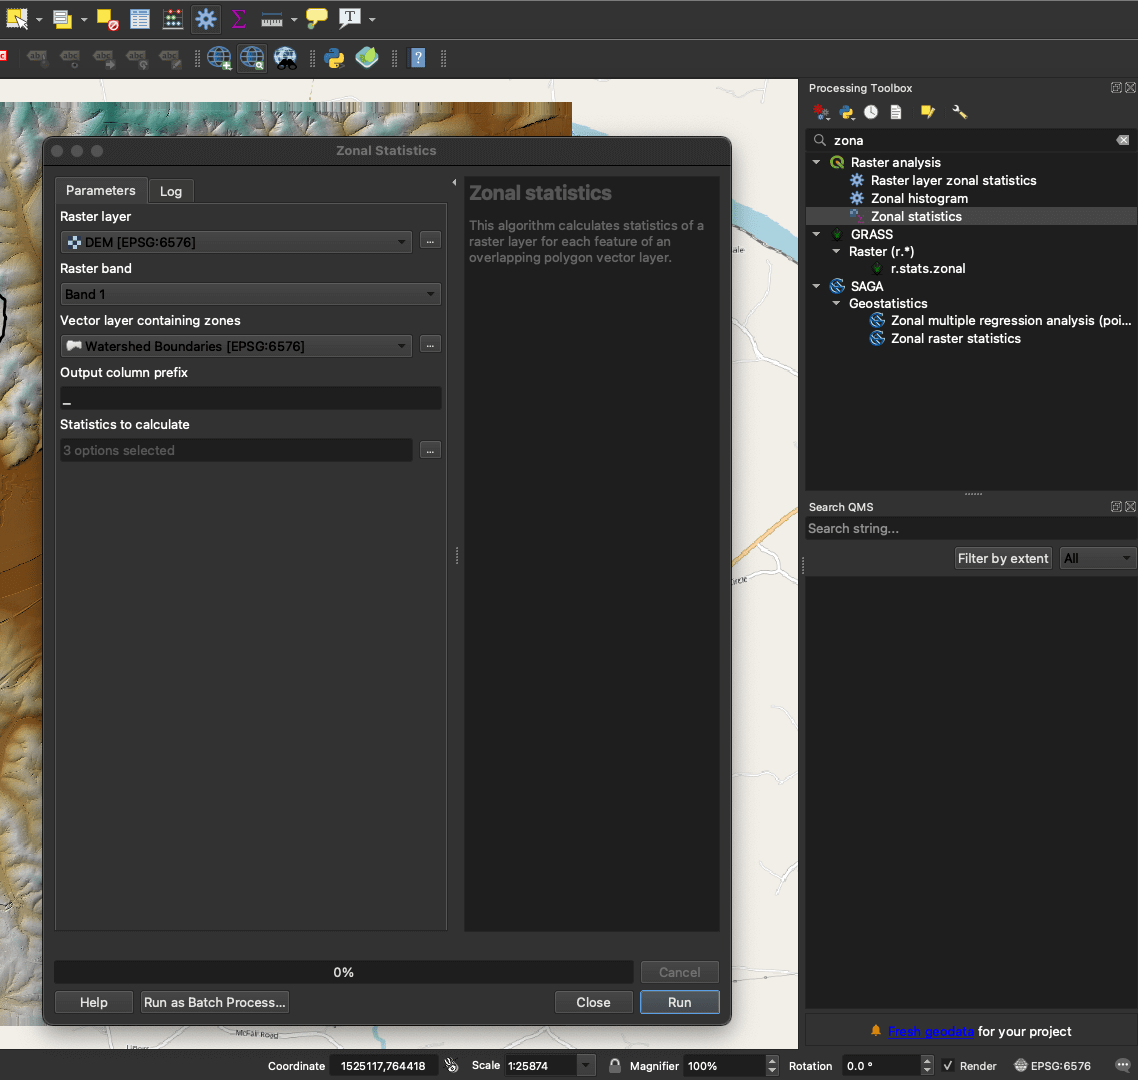
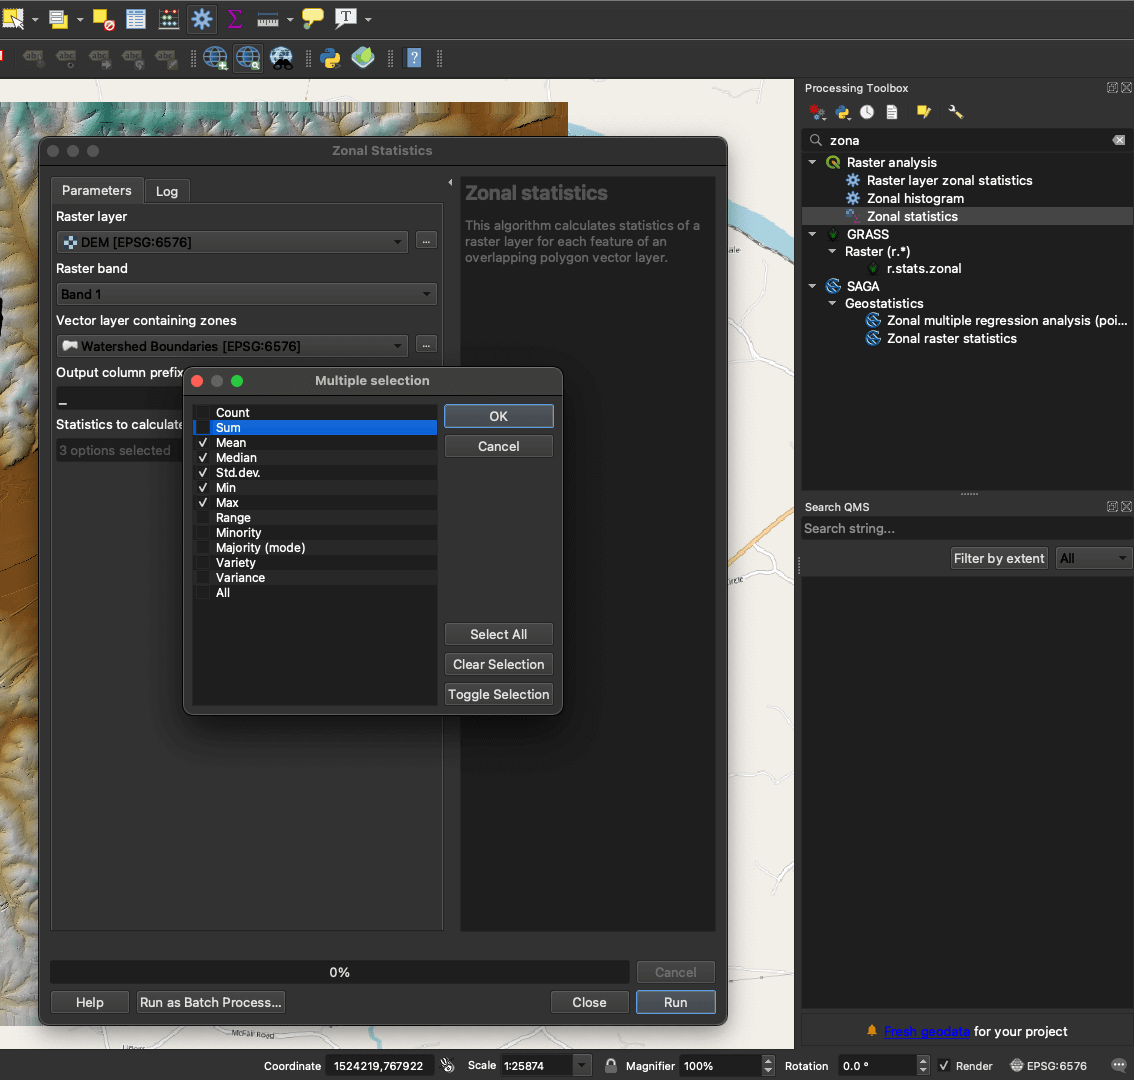
Zonal Statistics tool
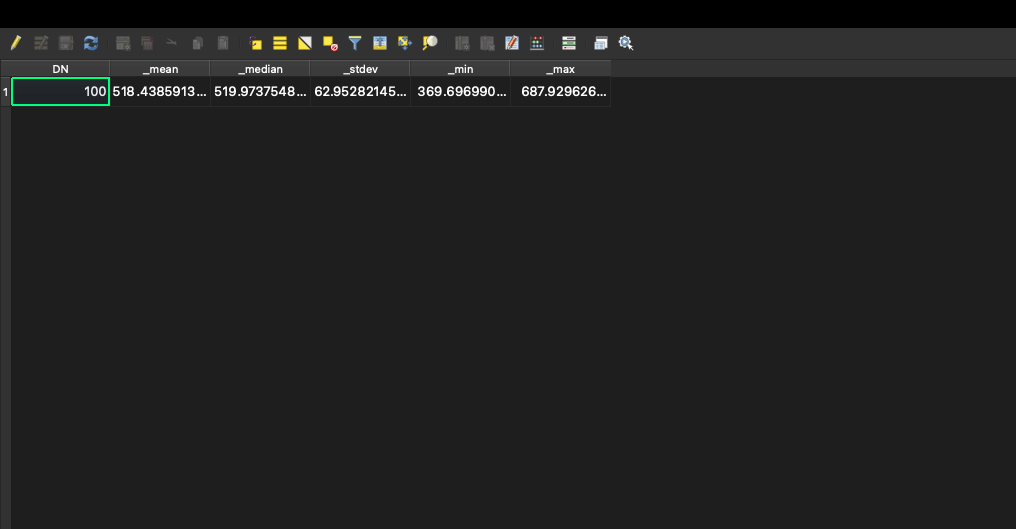
Before and after calculating Zonal Statistics with the Zonal Statistics tool
Done!
You should now have an updated attribute table for your watershed polygon, highlighting your Zonal Statistics! We hope this helped, and feel free to take a look at some of Equator’s other blogs and “How-to tutorials”!