Step 1
Upload DEM Data
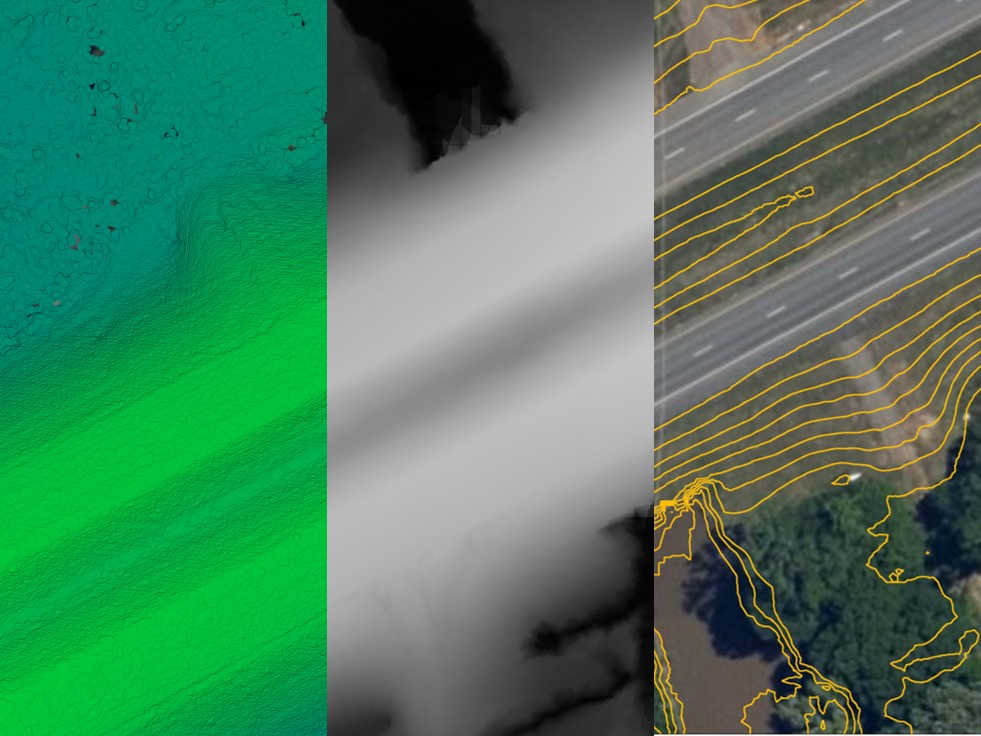
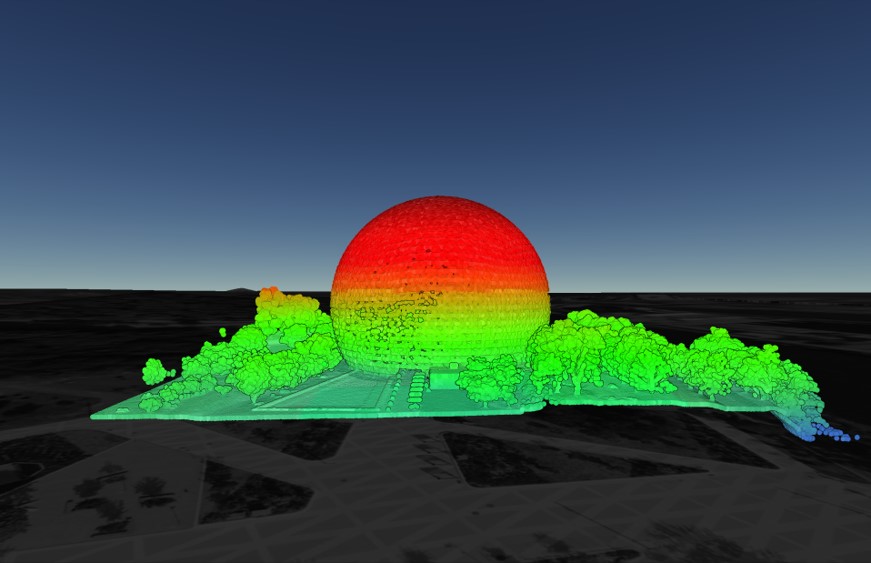
Before we can extract any surface flow directions, we will need to upload our DEM (Digital Elevation Model) from the Equator Site Builder. We use Equator’s Site Builder as it provides us with a plethora of high-resolution elevation data, with advanced features to enhance our project. Particularly, if we extract our data from the Site Builder, we won’t need to re-project our data into QGIS as the Site Builder already projects the data into the appropriate projected coordinate system. However, if you choose to extract your DEM from another source, then be sure to re-project your DEM to the appropriate coordinate system within QGIS!

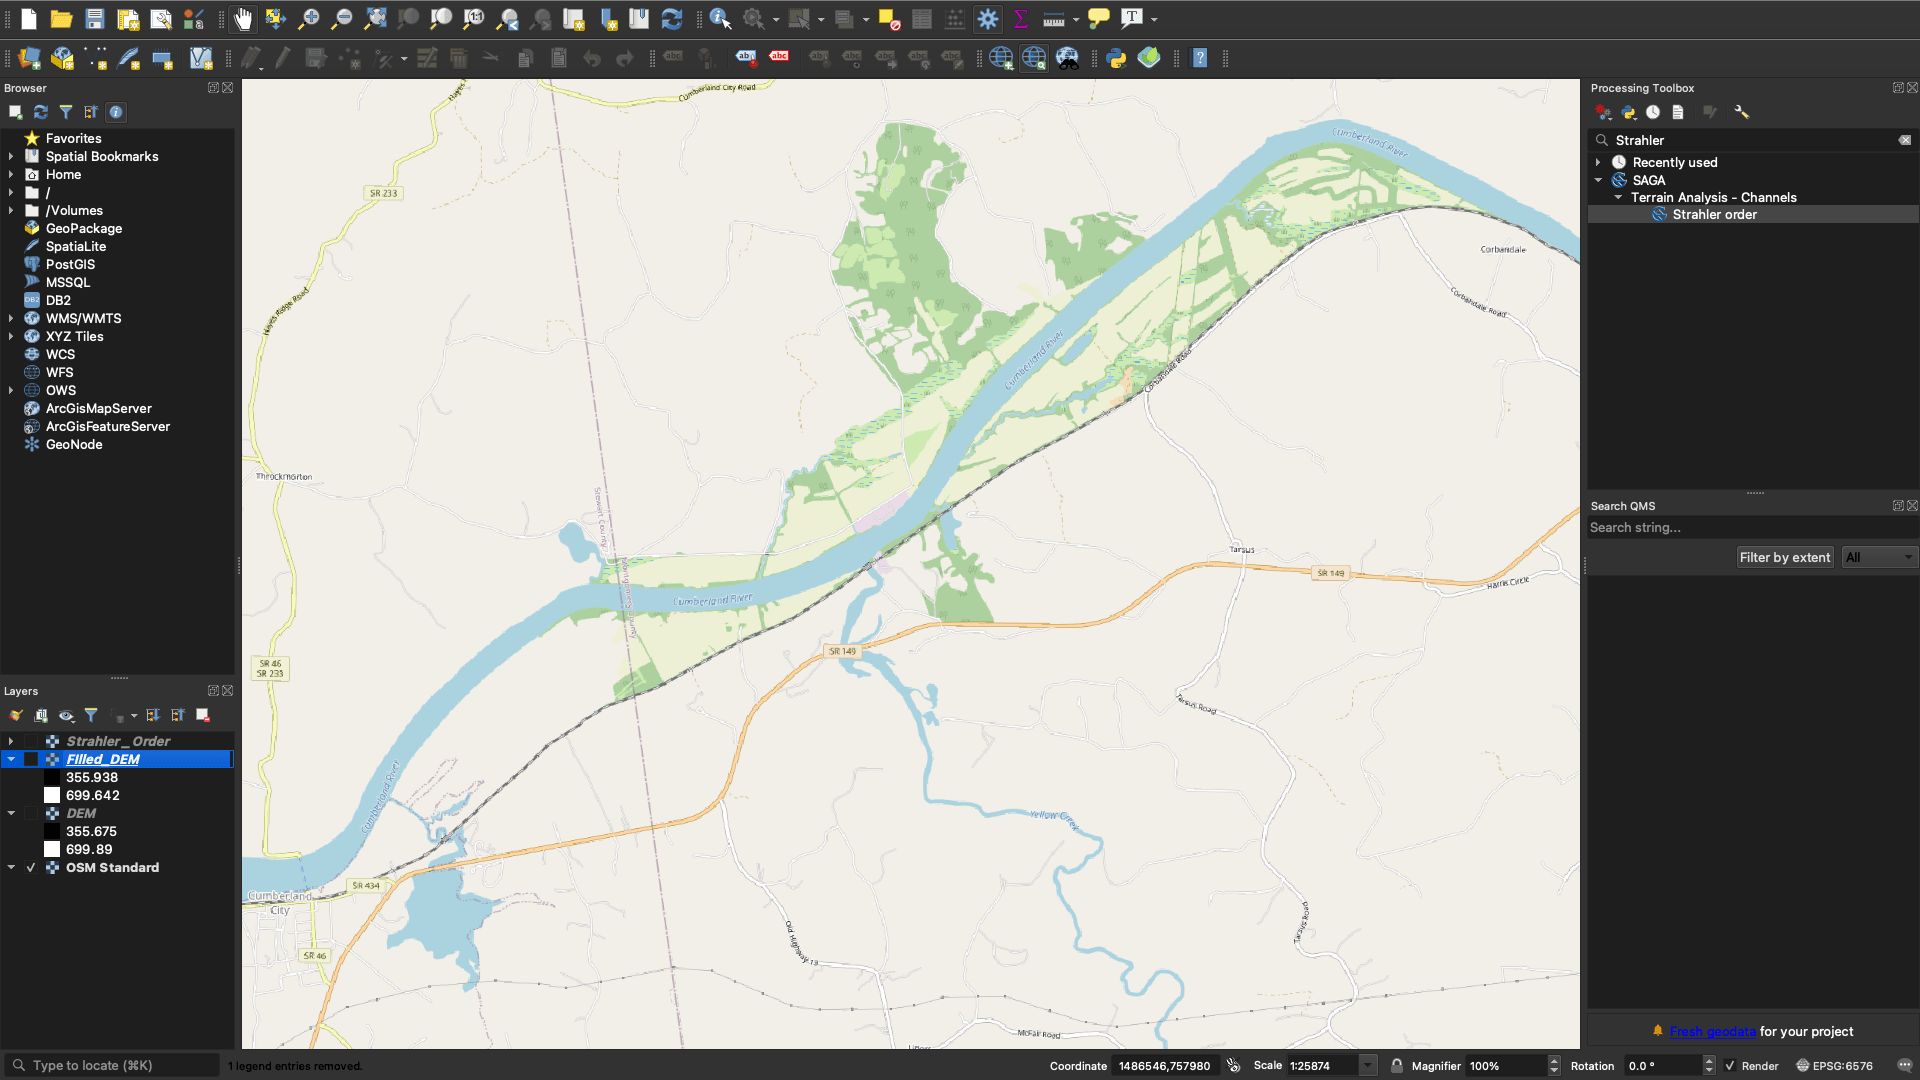
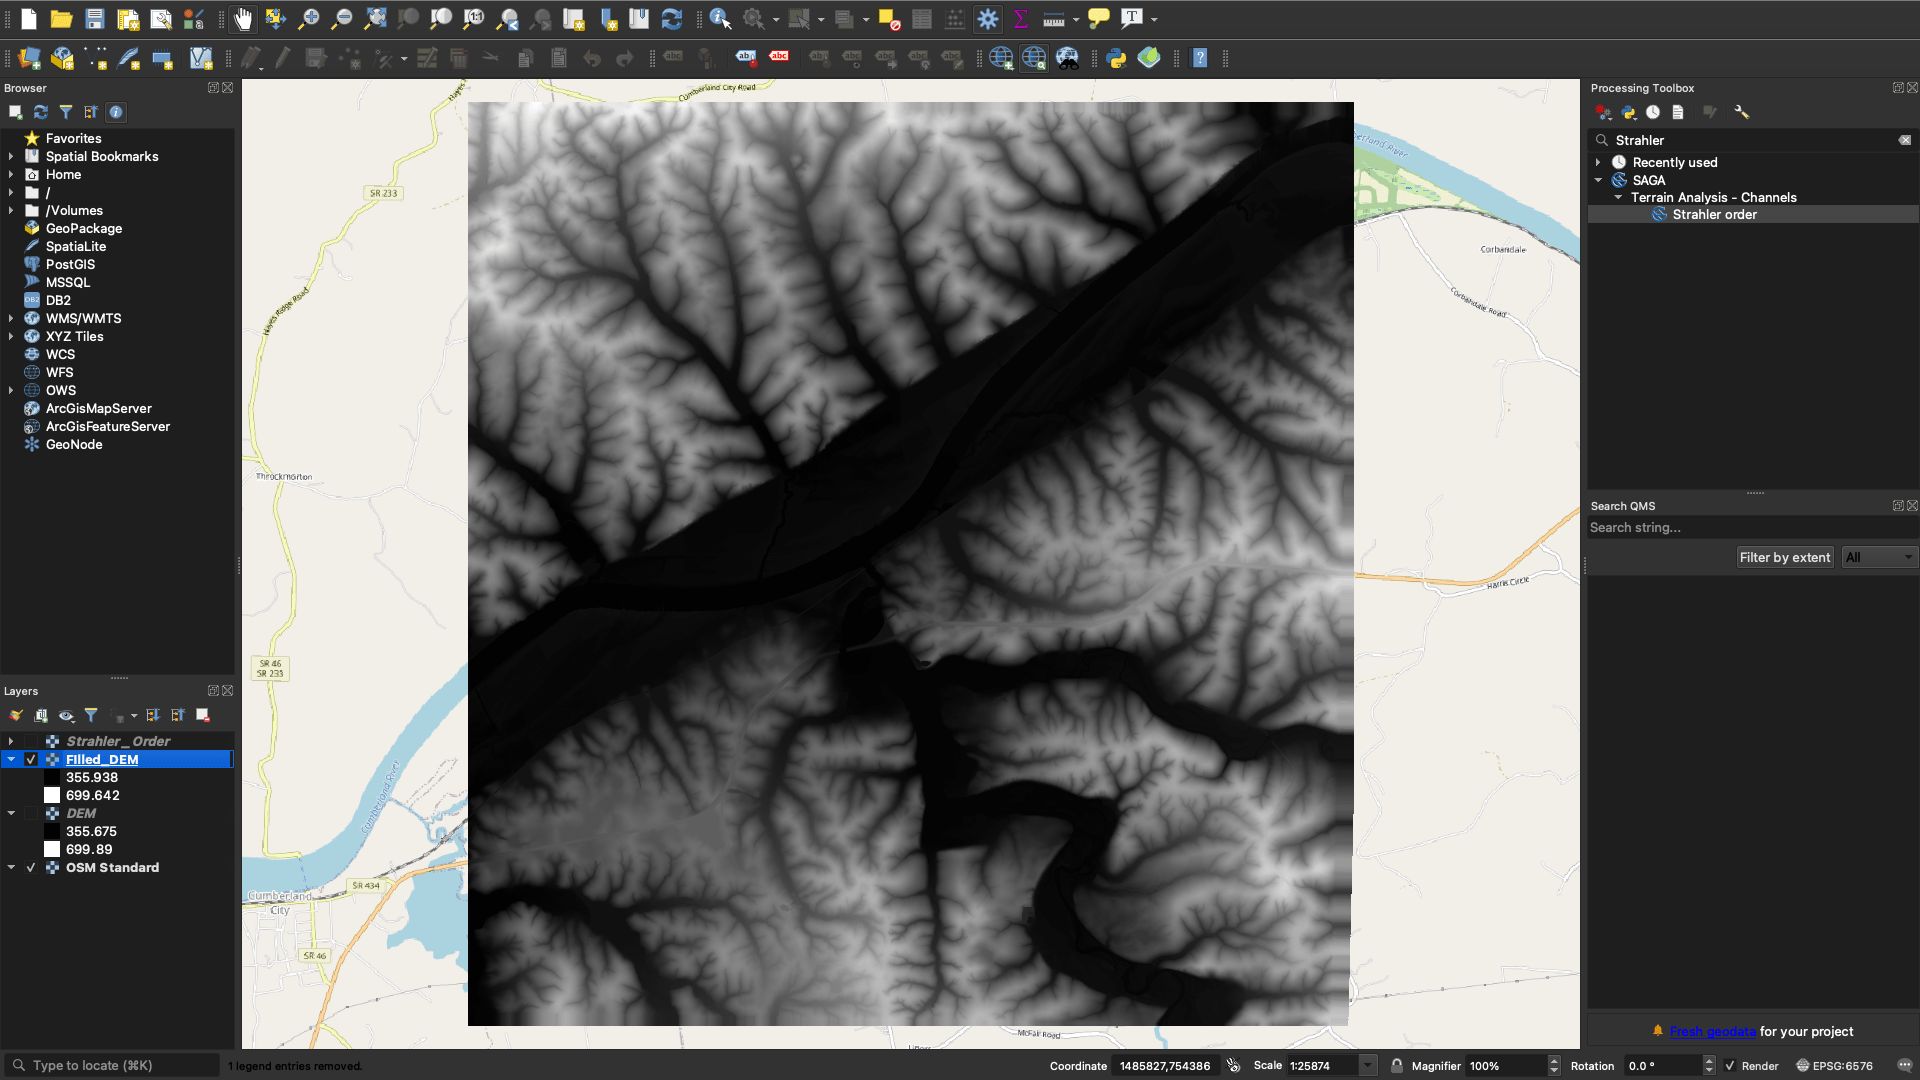
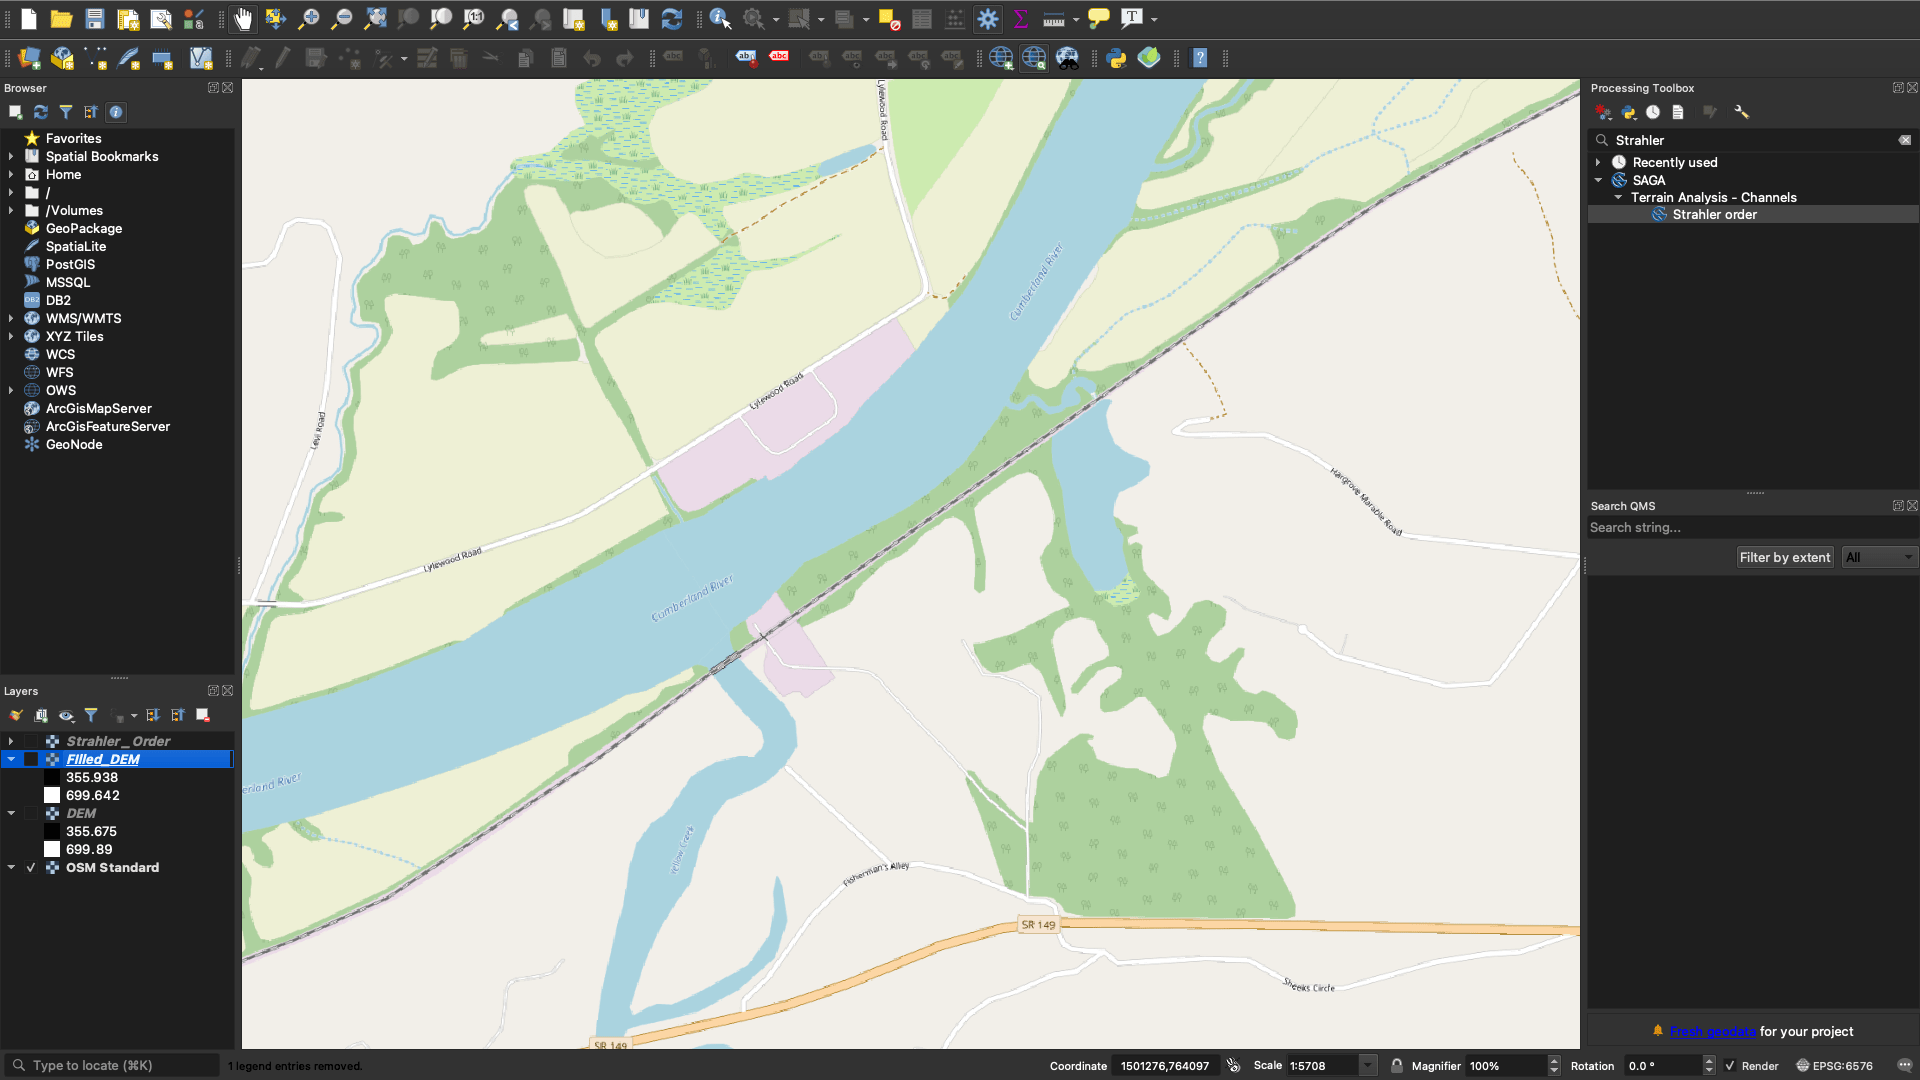
Image of our uploaded DEM from the Equator Site Builder
Step 2
Fill Sinks
Next, we will fill in the sinks, using Fill sinks (wang & liu) tool:
Processing Toolbox → SAGA → Fill sinks (wang & liu)
Be sure to select Filled DEM as your only Output File as we will use a different tool to generate our Flow Direction with the new Filled DEM output.
 tool, with correct input and output settings")
Fill Sink tool with correct inputs and outputs
Step 3
Generate the Stream network
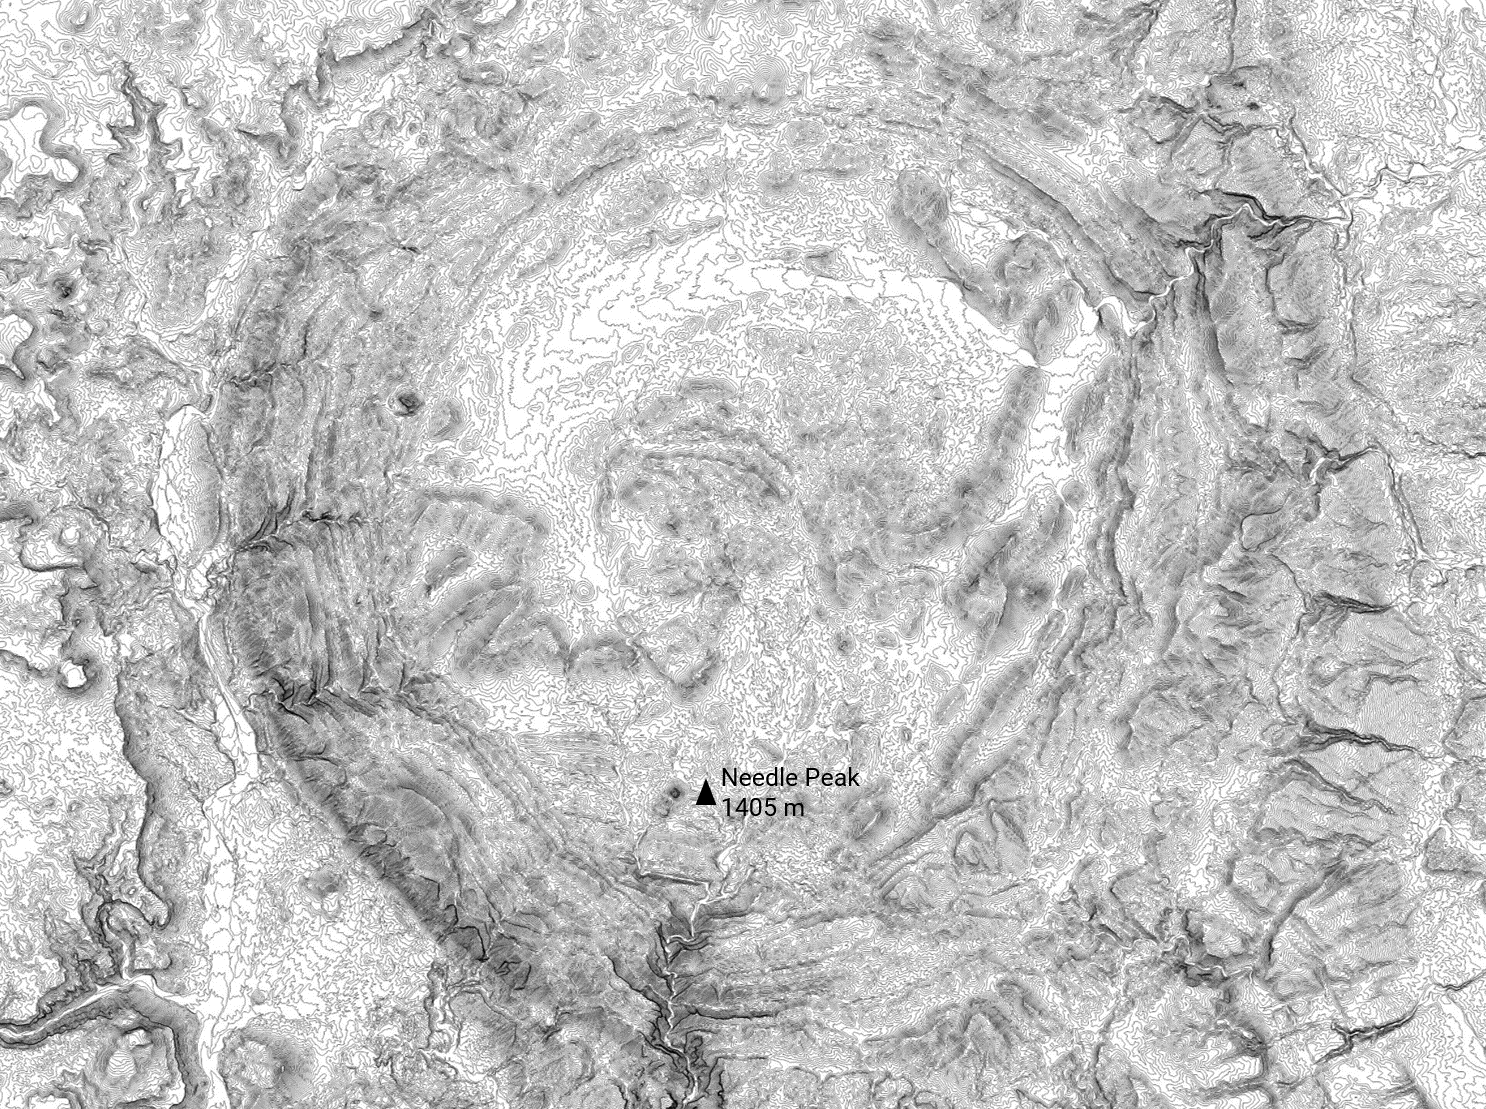
Now that we have projected our DEM onto our project, we will generate a Strahler Order to outline our stream network. This is important as it will be one of the main indicators of the water network and the morphology in general. To generate our Strahler Order, we will use the Strahler Order tool:
Processing Toolbox → SAGA → Terrain Analysis – Channels → Strahler Order
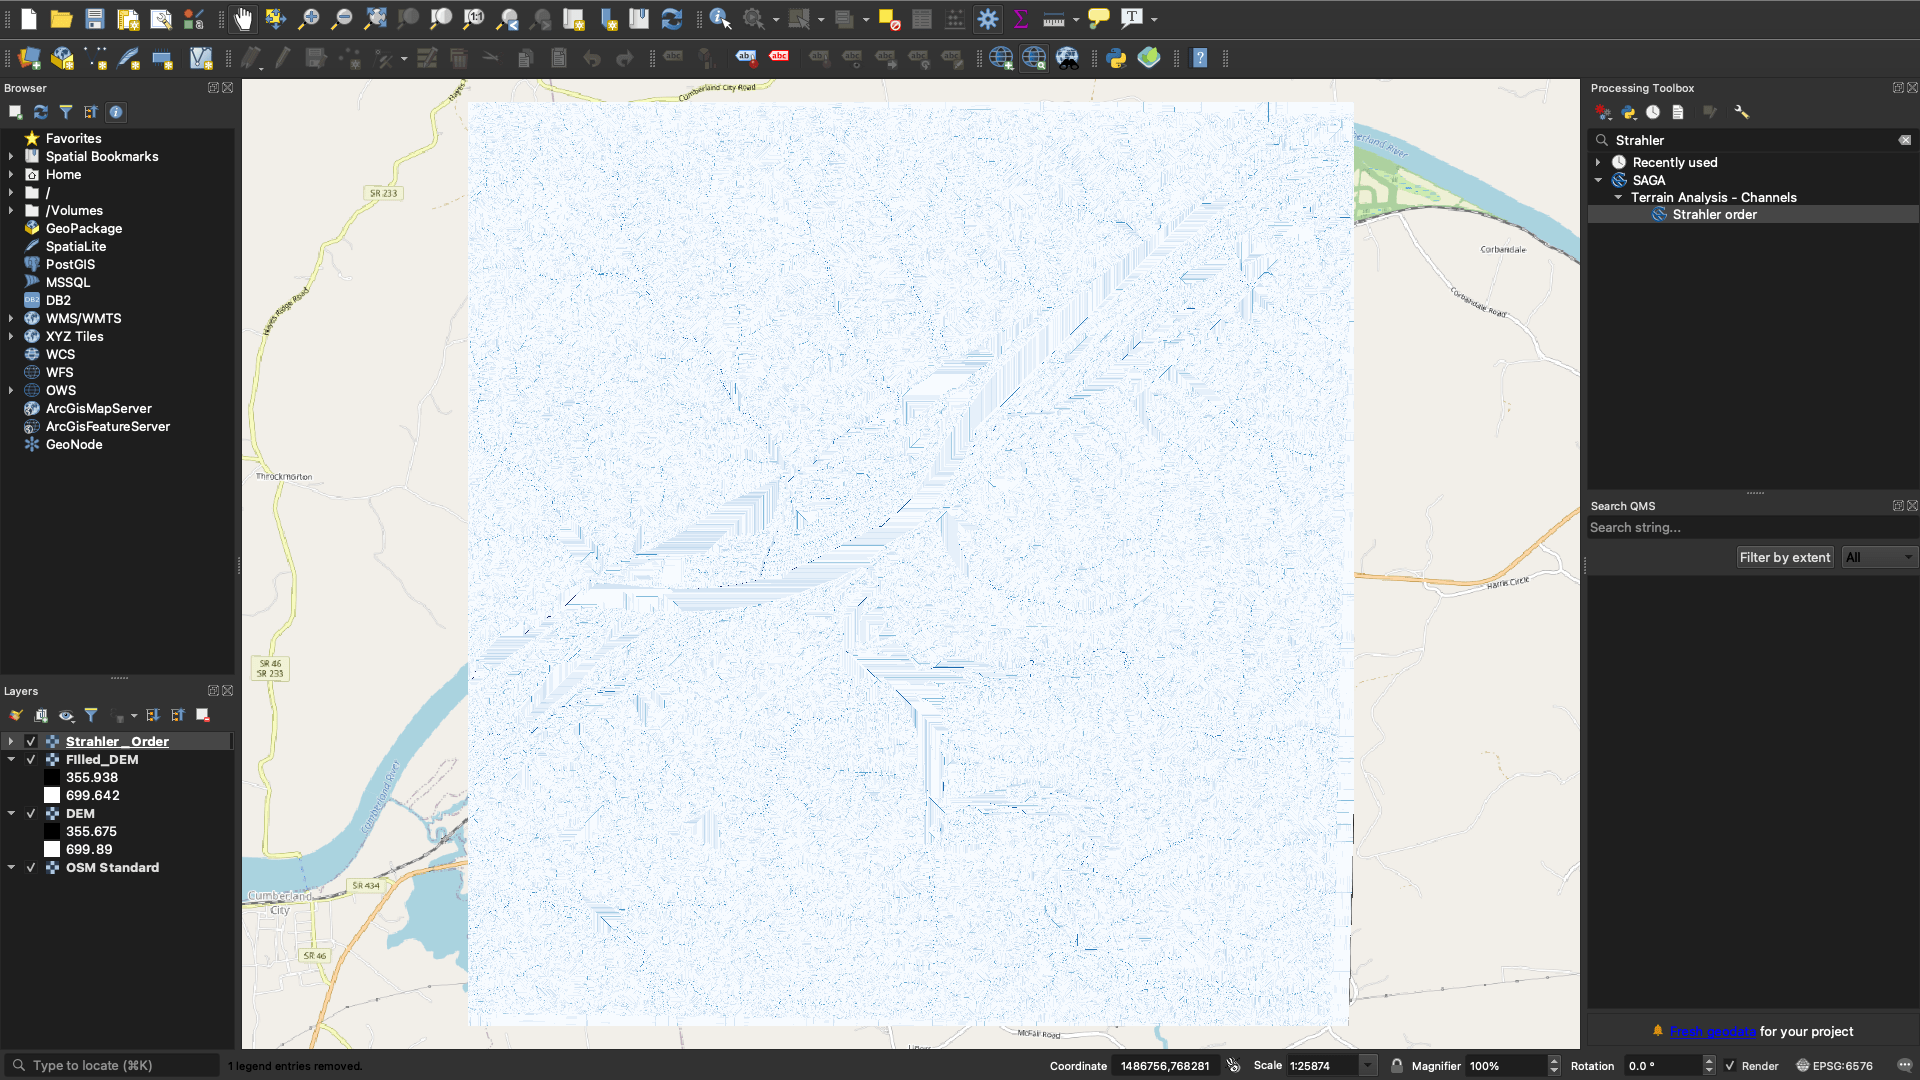
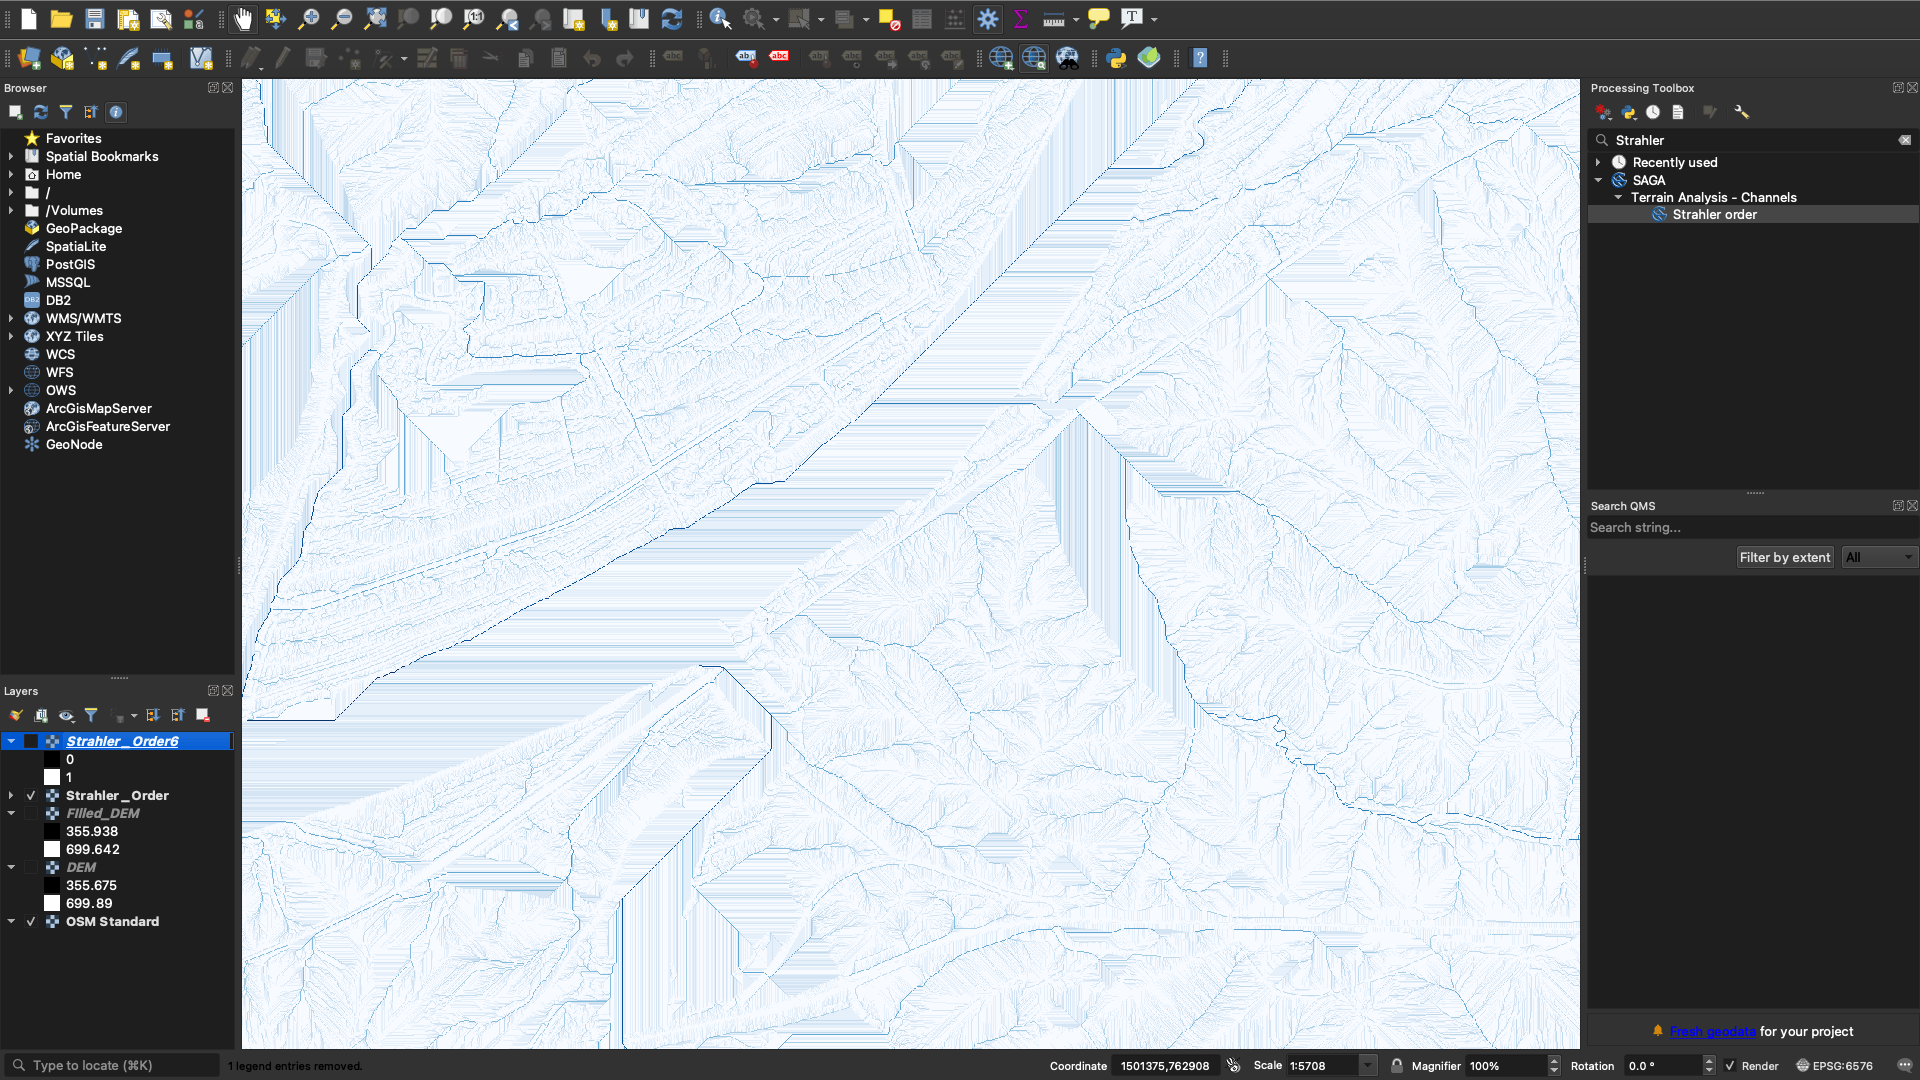
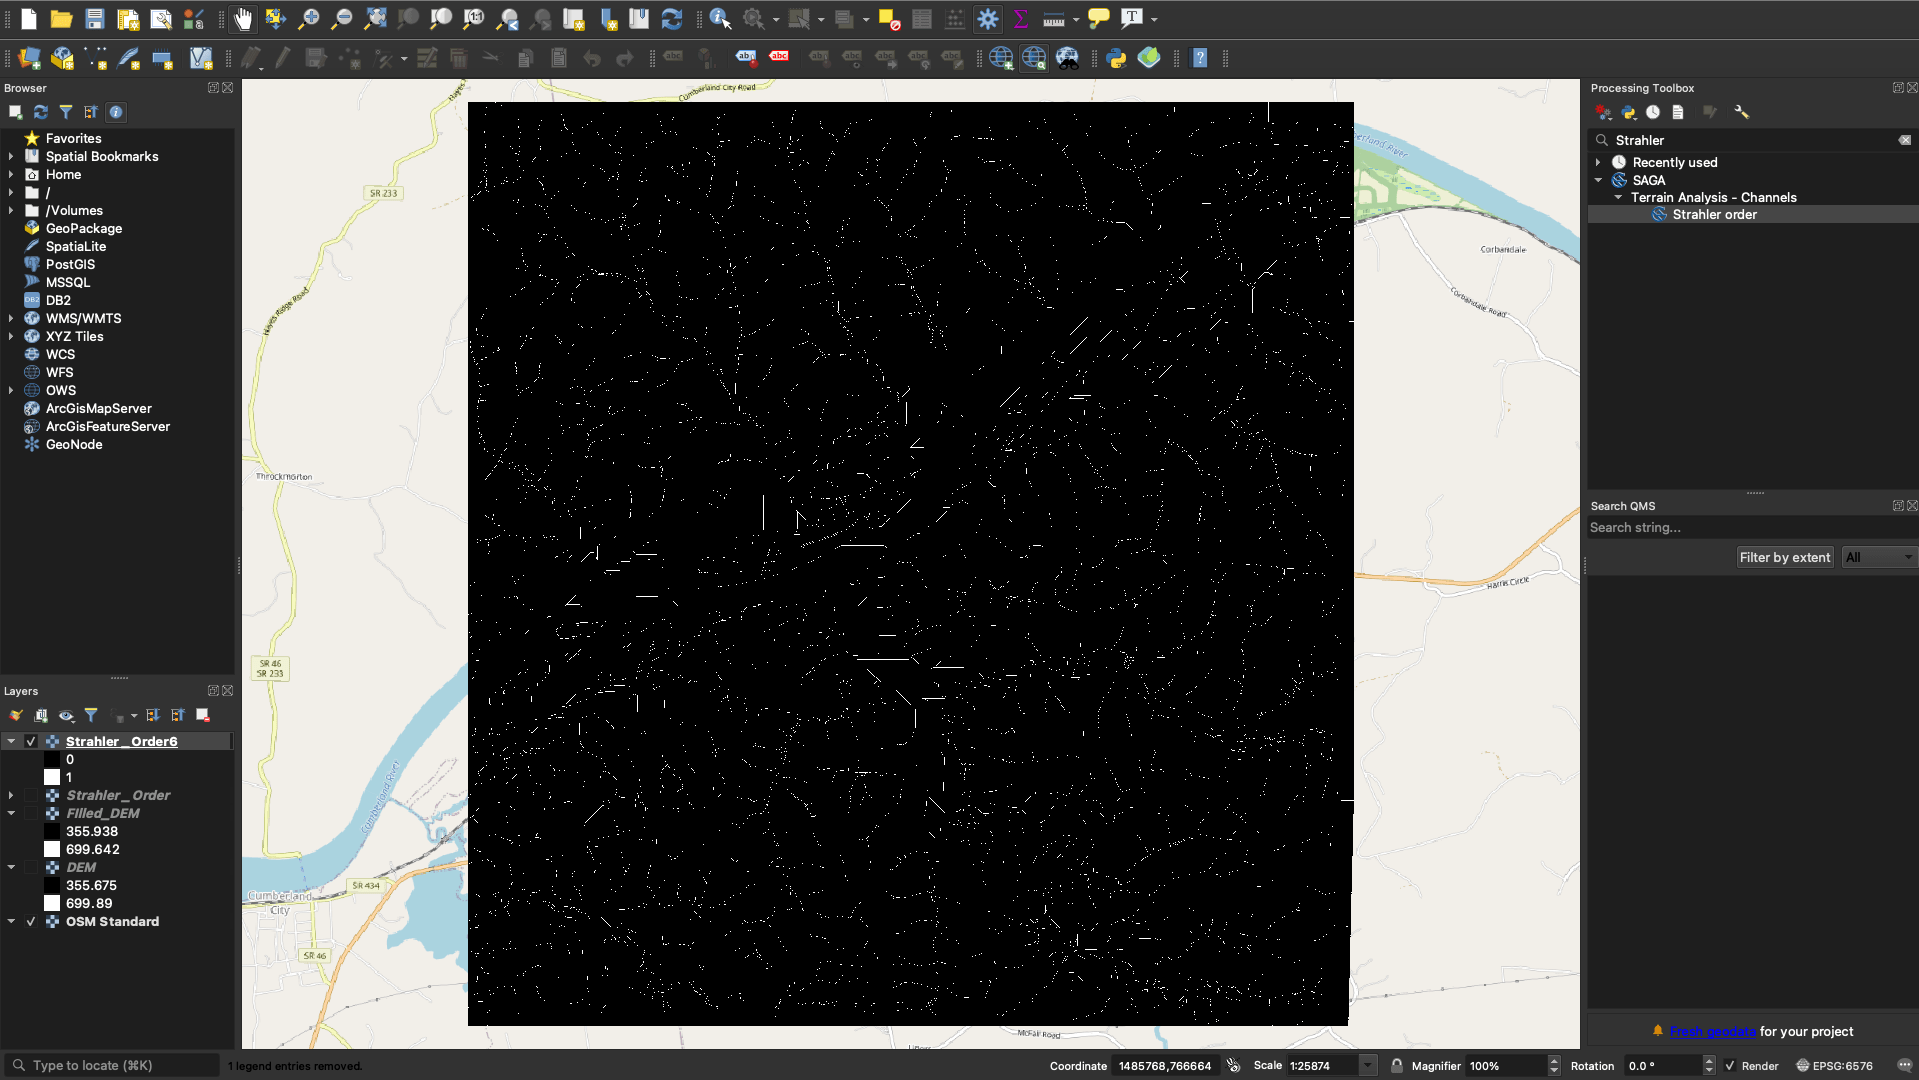
Once you run the tool, a stream network should be generated as per the 2nd image in the slideshow below:

Strahler Order tool with correct inputs and outputs
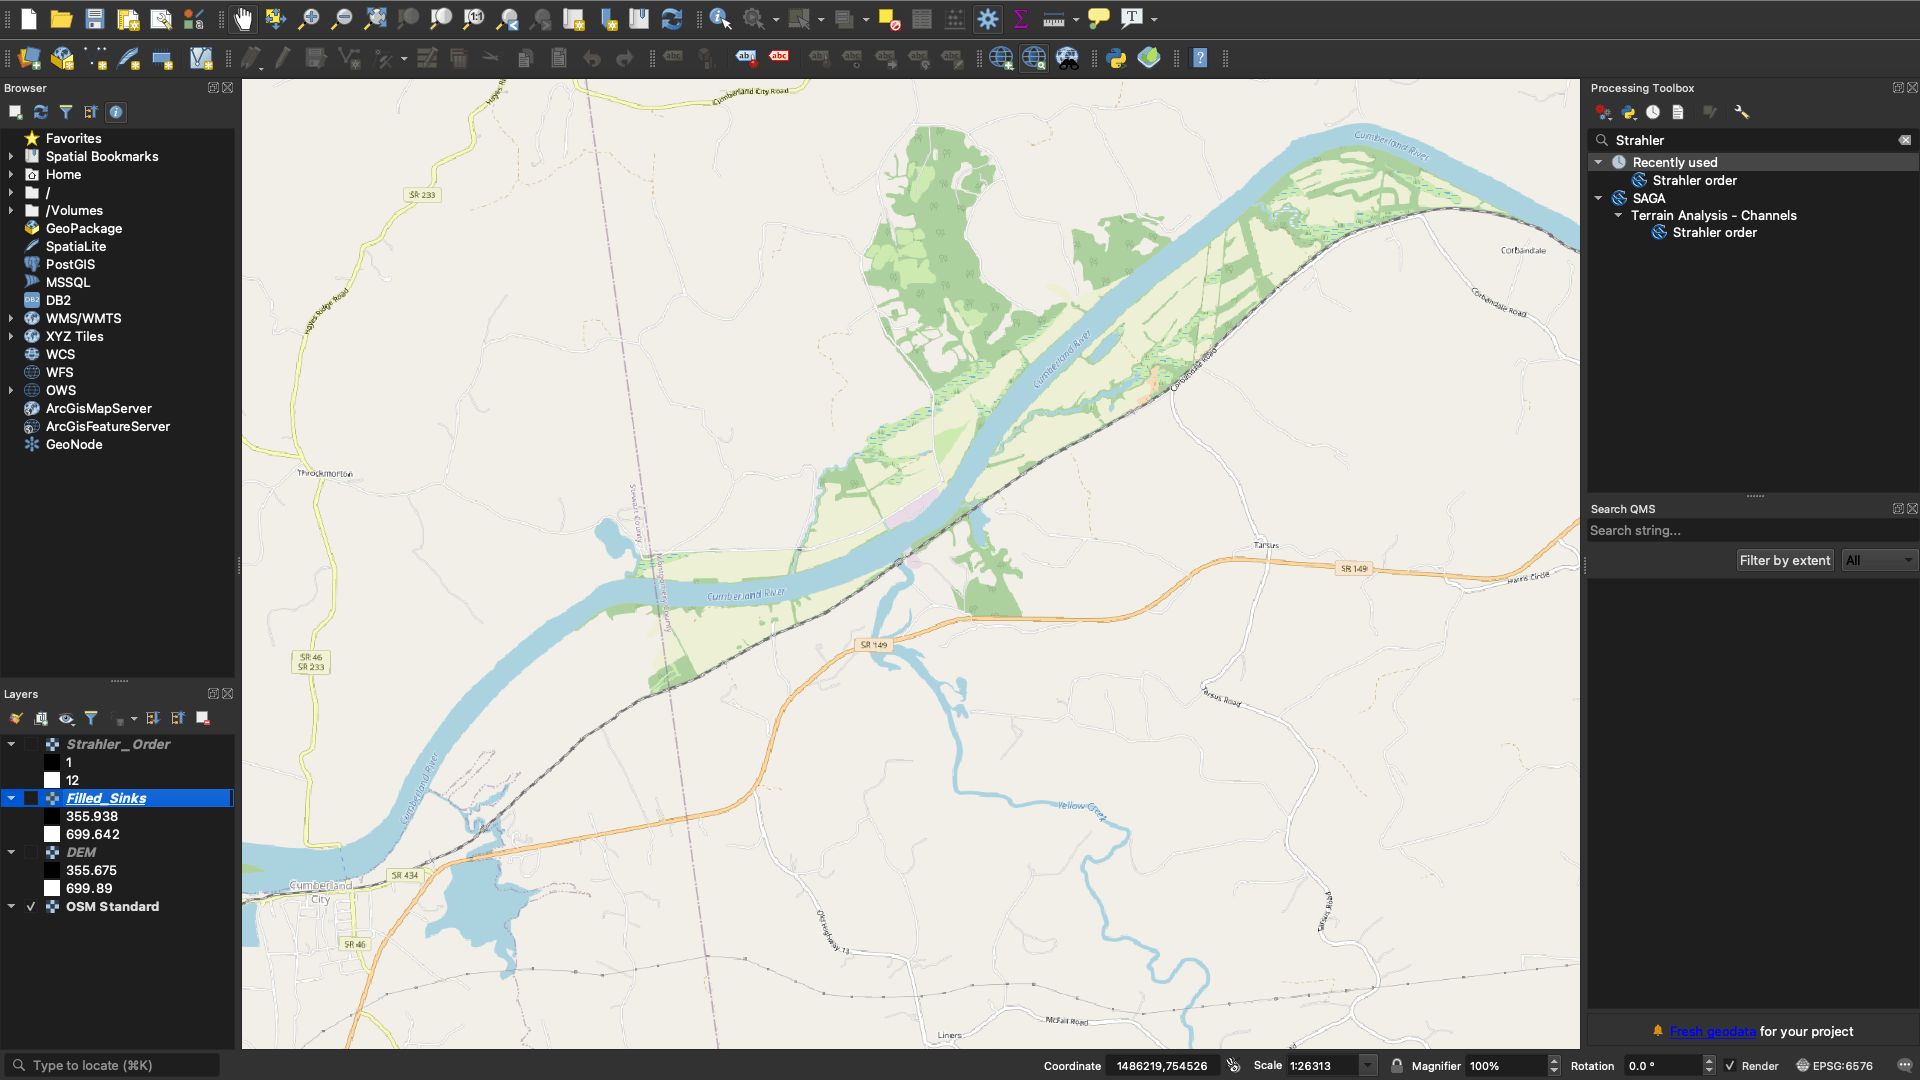
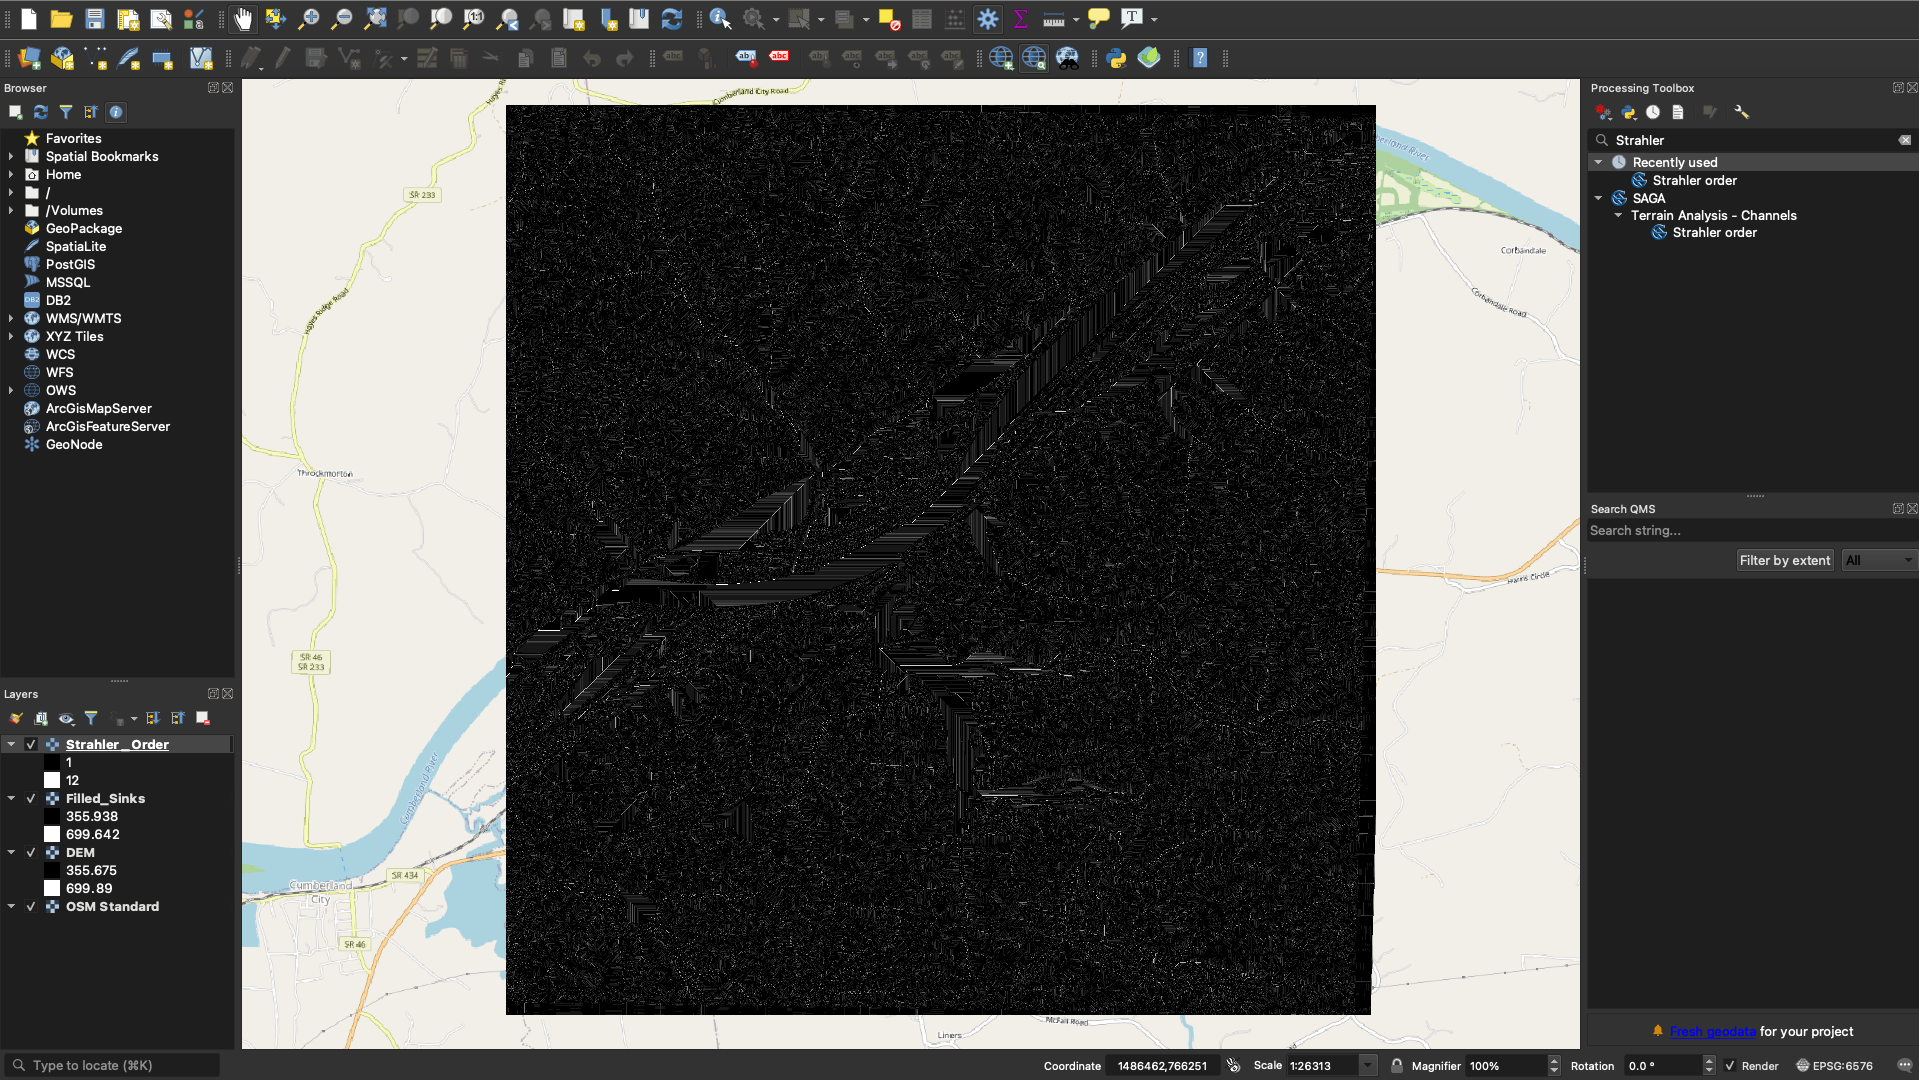
Strahler Order before and after
Step 4
Change the Symbology
Having generated a network, we will want to change the symbology in order to identify the strahler values of the various streams. This will be important as it will provide us with a threshold which we will use to generate our Flow Direction. Go into the properties of your Strahler_Order and change the symbology :
Strahler_Order → Properties → Symbology
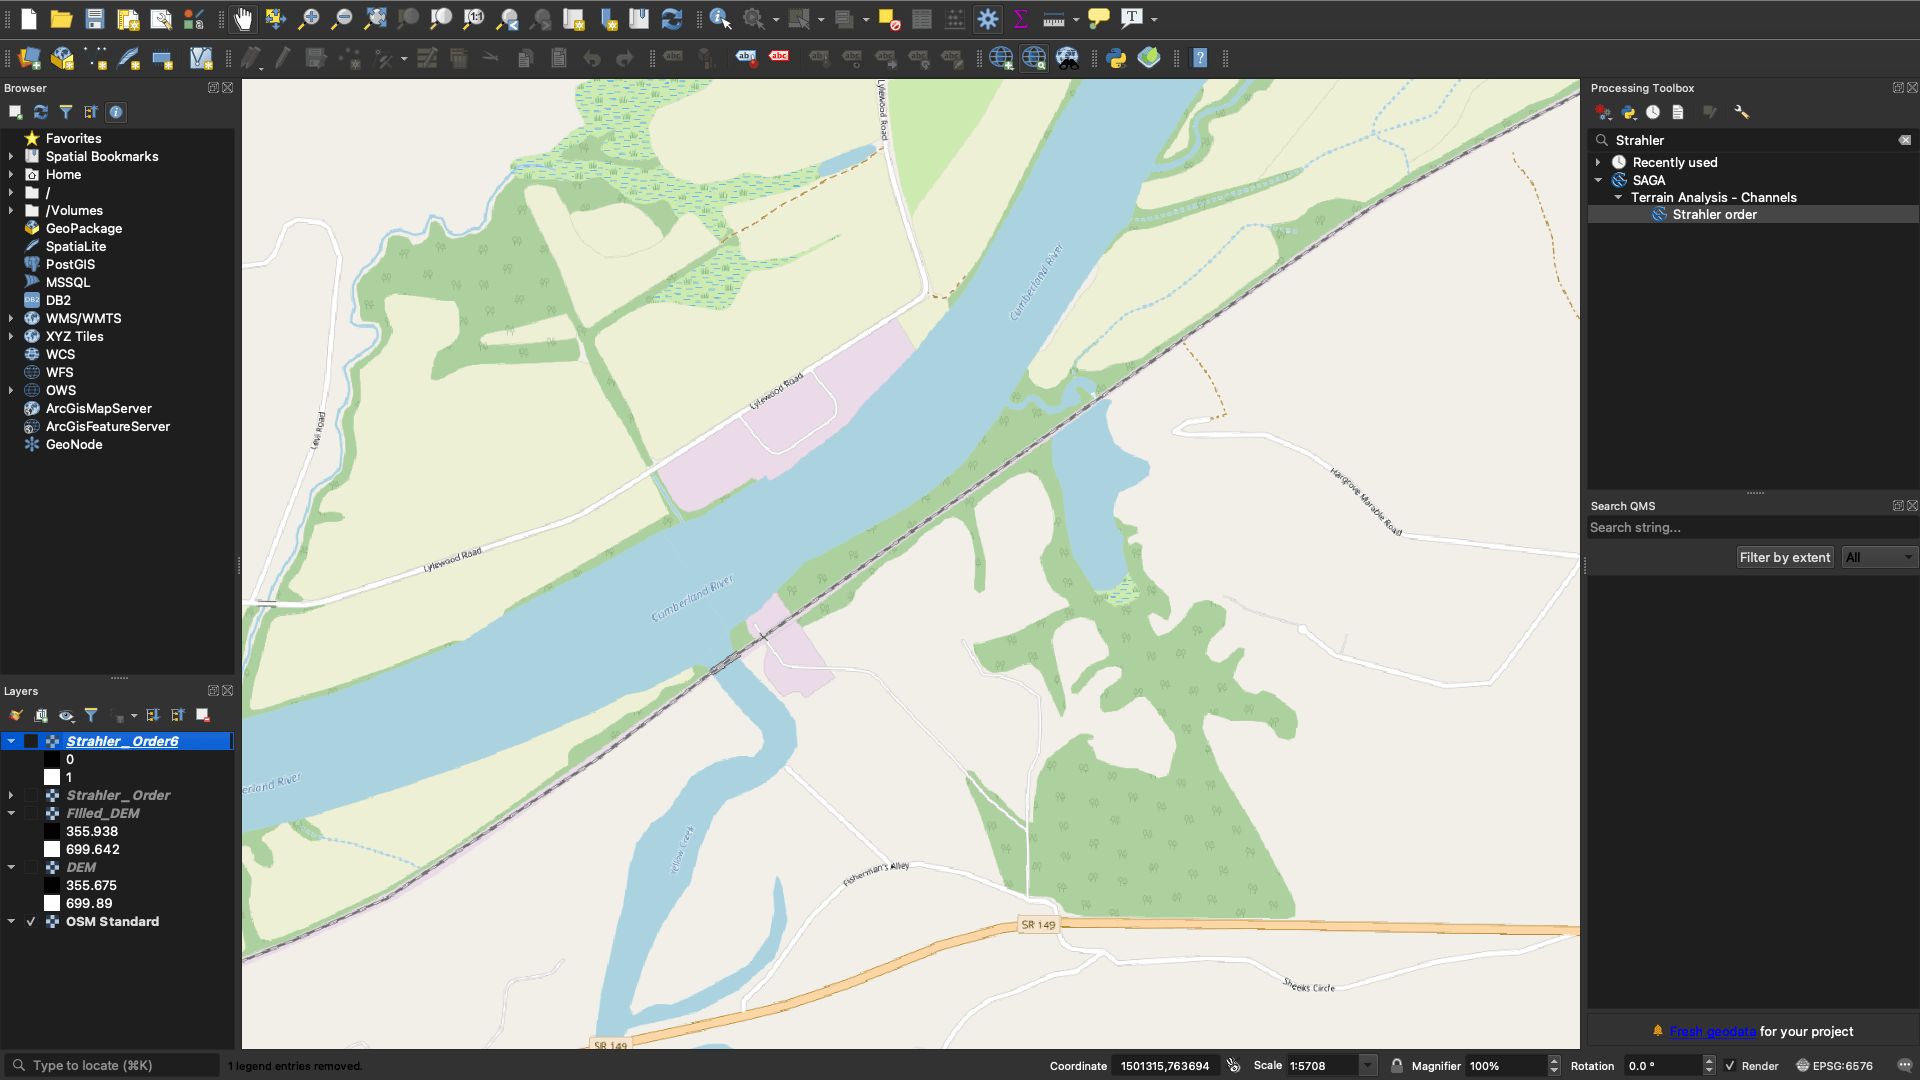
Set your Render type to Singleband pseudocolor and change your Mode to be Equal Interval. Select the number of Classes in accordance to the maximum Strahler Number that is provided, in our case it was 12. Once you have completed this step, your Strahler_Order should look something like how it does in the 3rd and 5th images of the slideshow below:

Improving the symbology for the Strahler_Order
Updated symbology for Strahler Order, before and after
Step 5
Identify a Threshold
Now, with our new symbology classifying the Strahler Order for our stream network, we can identify a threshold for the streams we want to focus on in our flow direction. This threshold will be decided by you based on your own Strahler Order and needs. We can filter the stream network in accordance to this number by selecting the Raster Calculator tool:
Raster → Raster Calculator
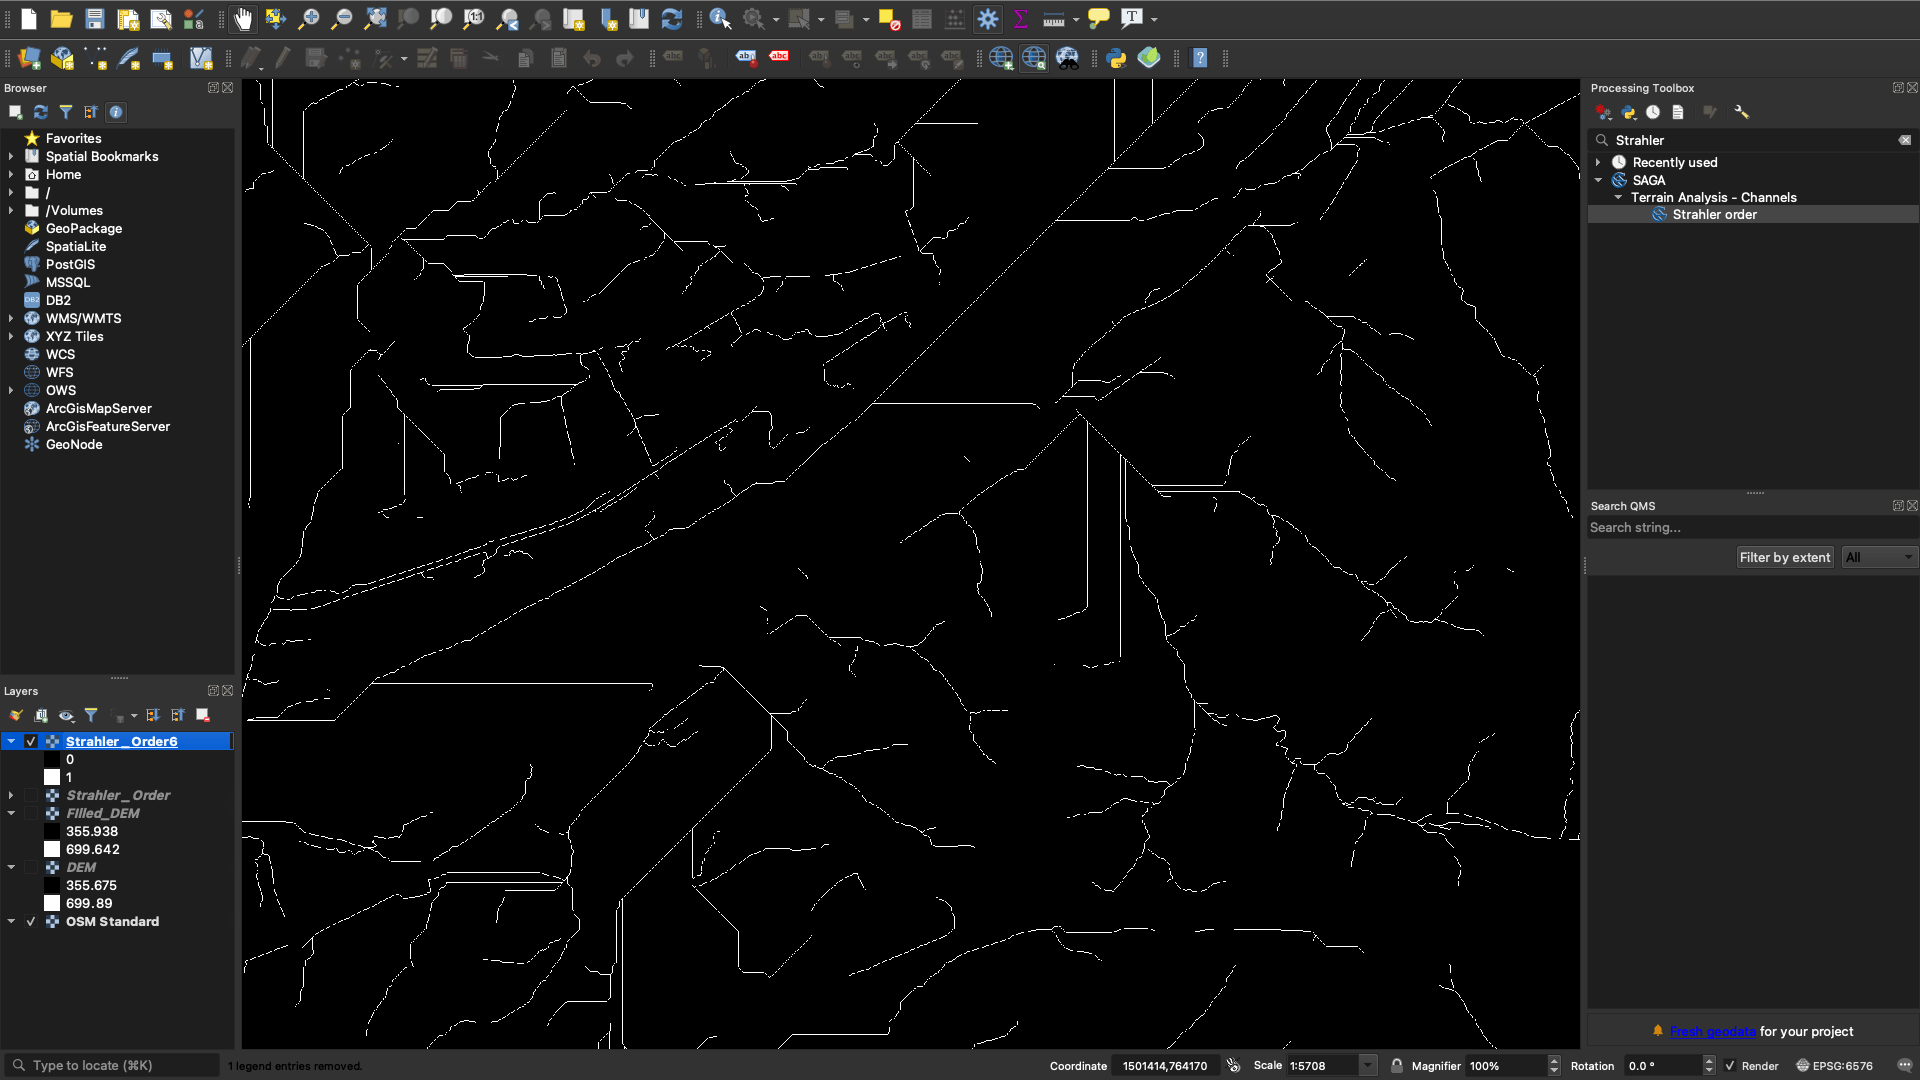
Here, we input a Raster Calculator Expression where we isolate those streams that possess a Strahler Number greater than or equal to our threshold (6 being our threshold). In your own project, you may elect a different number in accordance to your own needs. Be sure to confirm your Output CRS is correct, and set an Output Layer. (Examples in Images 3 & 4 of slideshow):

Raster Calculator with correct inputs

Step 6
Generate the Flow Direction
Finally, we will generate the Flow Direction for our DEM using the Channel Network and Drainage Basins tool:
Processing Toolbox → SAGA → Terrain Analysis – Channels → Channel Network and Drainage Basins
Using the Channel Network and Drainage Basins tool, set the Threshold as the Strahler Number you used to filter your stream network in the previous step (in this case our threshold was 6). Be sure to select Flow Direction as your only Output File and set your Elevation to your Filled_DEM.

Channel Network and Drainage Basins tool with correct input and output settings

Generated Flow Direction
Step 7
Change the Symbology of Flow Direction
We have our Flow Direction, now we need to change the symbology so that it reflects the information we are looking for (translate the current legend from values to directions). To do this, simply open up the symbology of your Flow_Direction layer:
Flow_Direction → Properties → Symbology
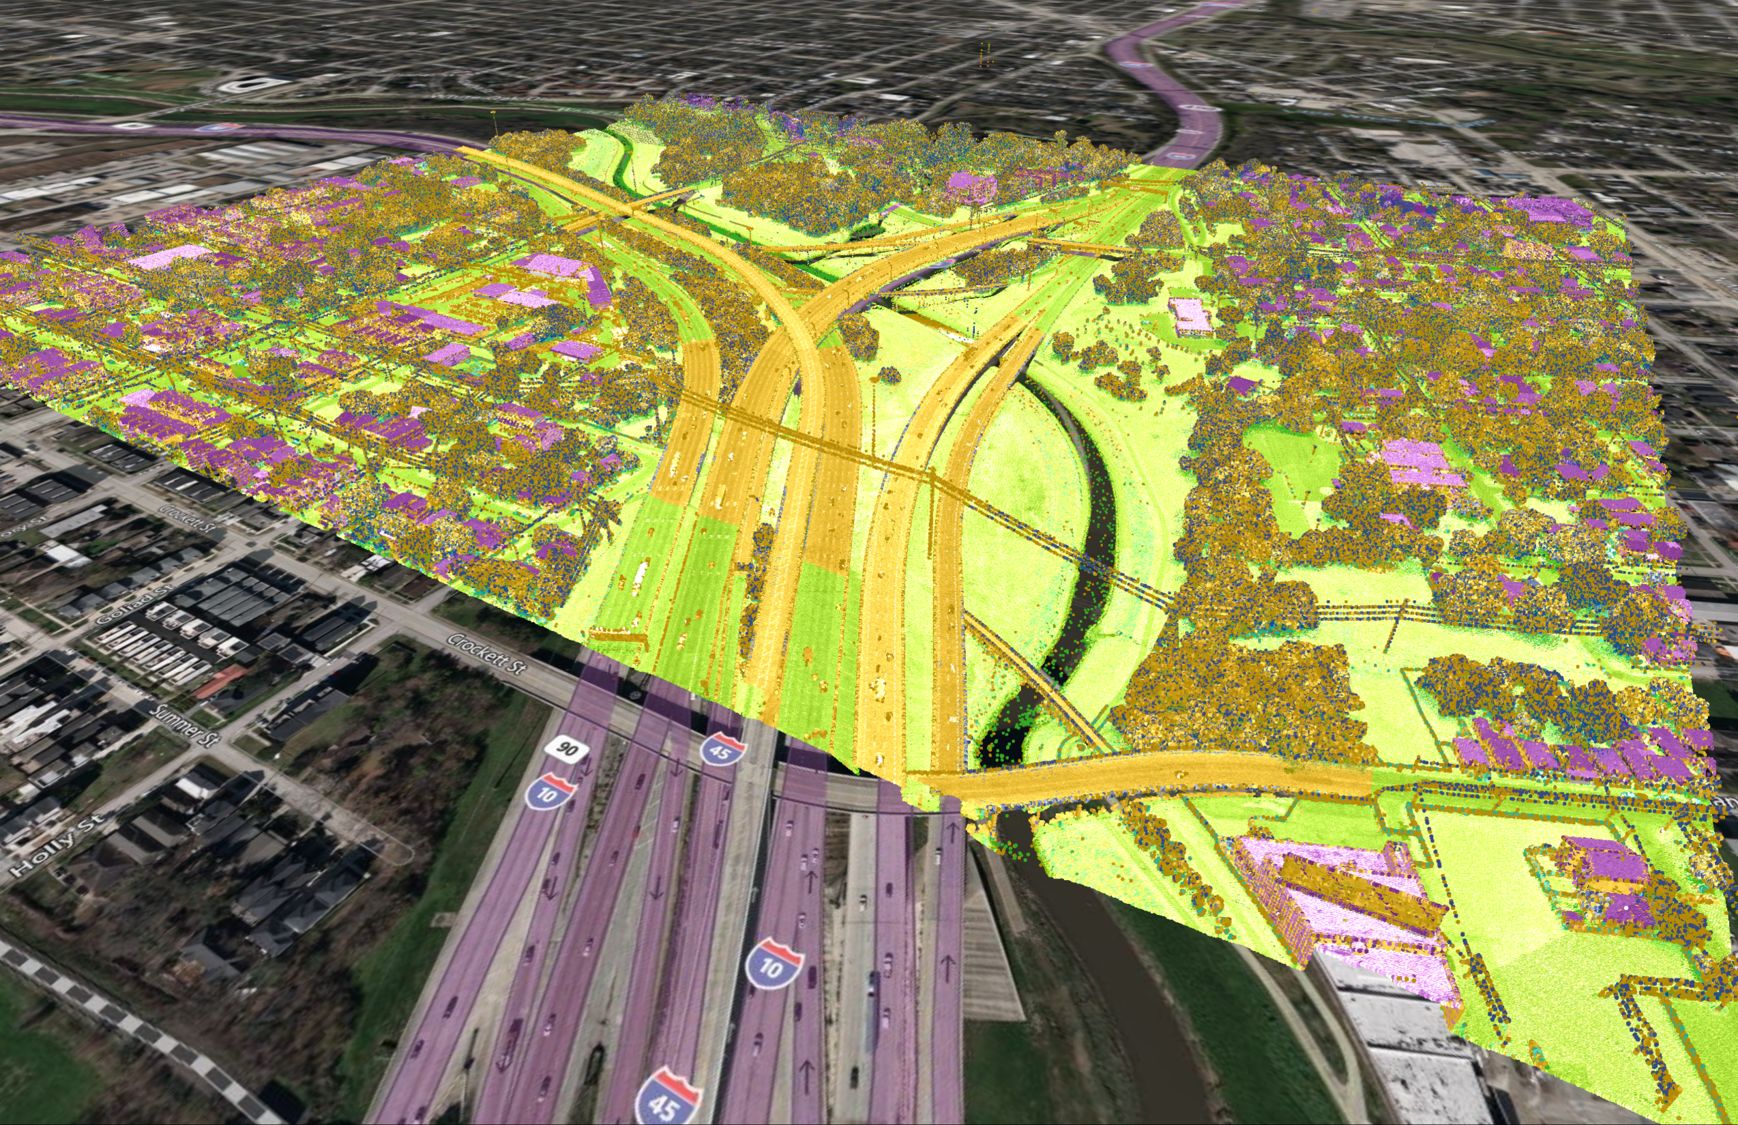
Set your Render type to Paletted/Unique values and click Classify to generate your values. Once you do, your legend should have values ranging from 0-7 with an additional value of 255, as per the image below:

Changing the symbology for Flow_Direction
Next, rename the labels as we have in the image below, as the compass directions are what is being represented for the values 0-7, whilst the 8th value (255) represents flat regions. Now change the colours of your legend as you deem fit. It may be appropriate (depending on your needs) to set unique colours for the four compass directions (North, East, South, West) whilst your other values graduate from these four unique colours, as is the case with ours. Be sure, however, to set your Flat value to an absolutely unique colour such as white, in order to emphasize it has no direction.

Changing the symbology for Flow_Direction
Done!
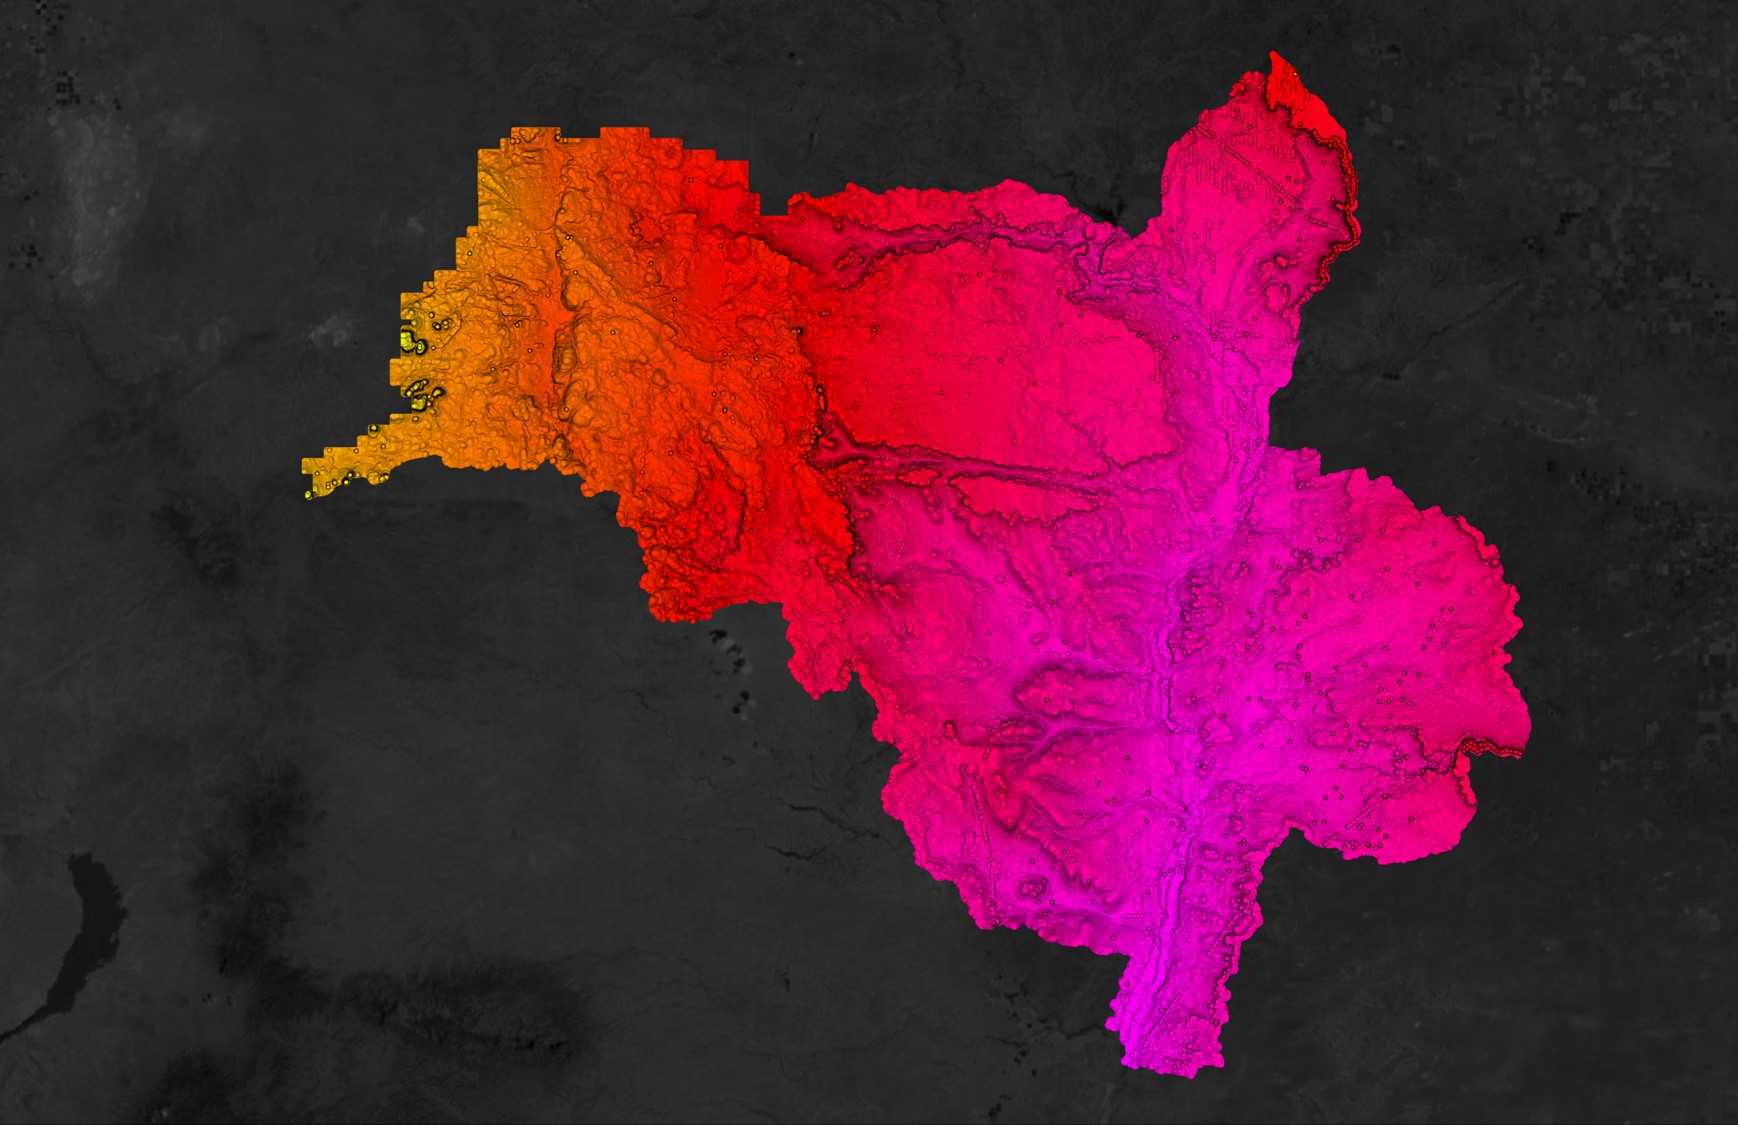
Finished! By now you should have your surface flow directions, which should look something similar to ours in the slideshow below:
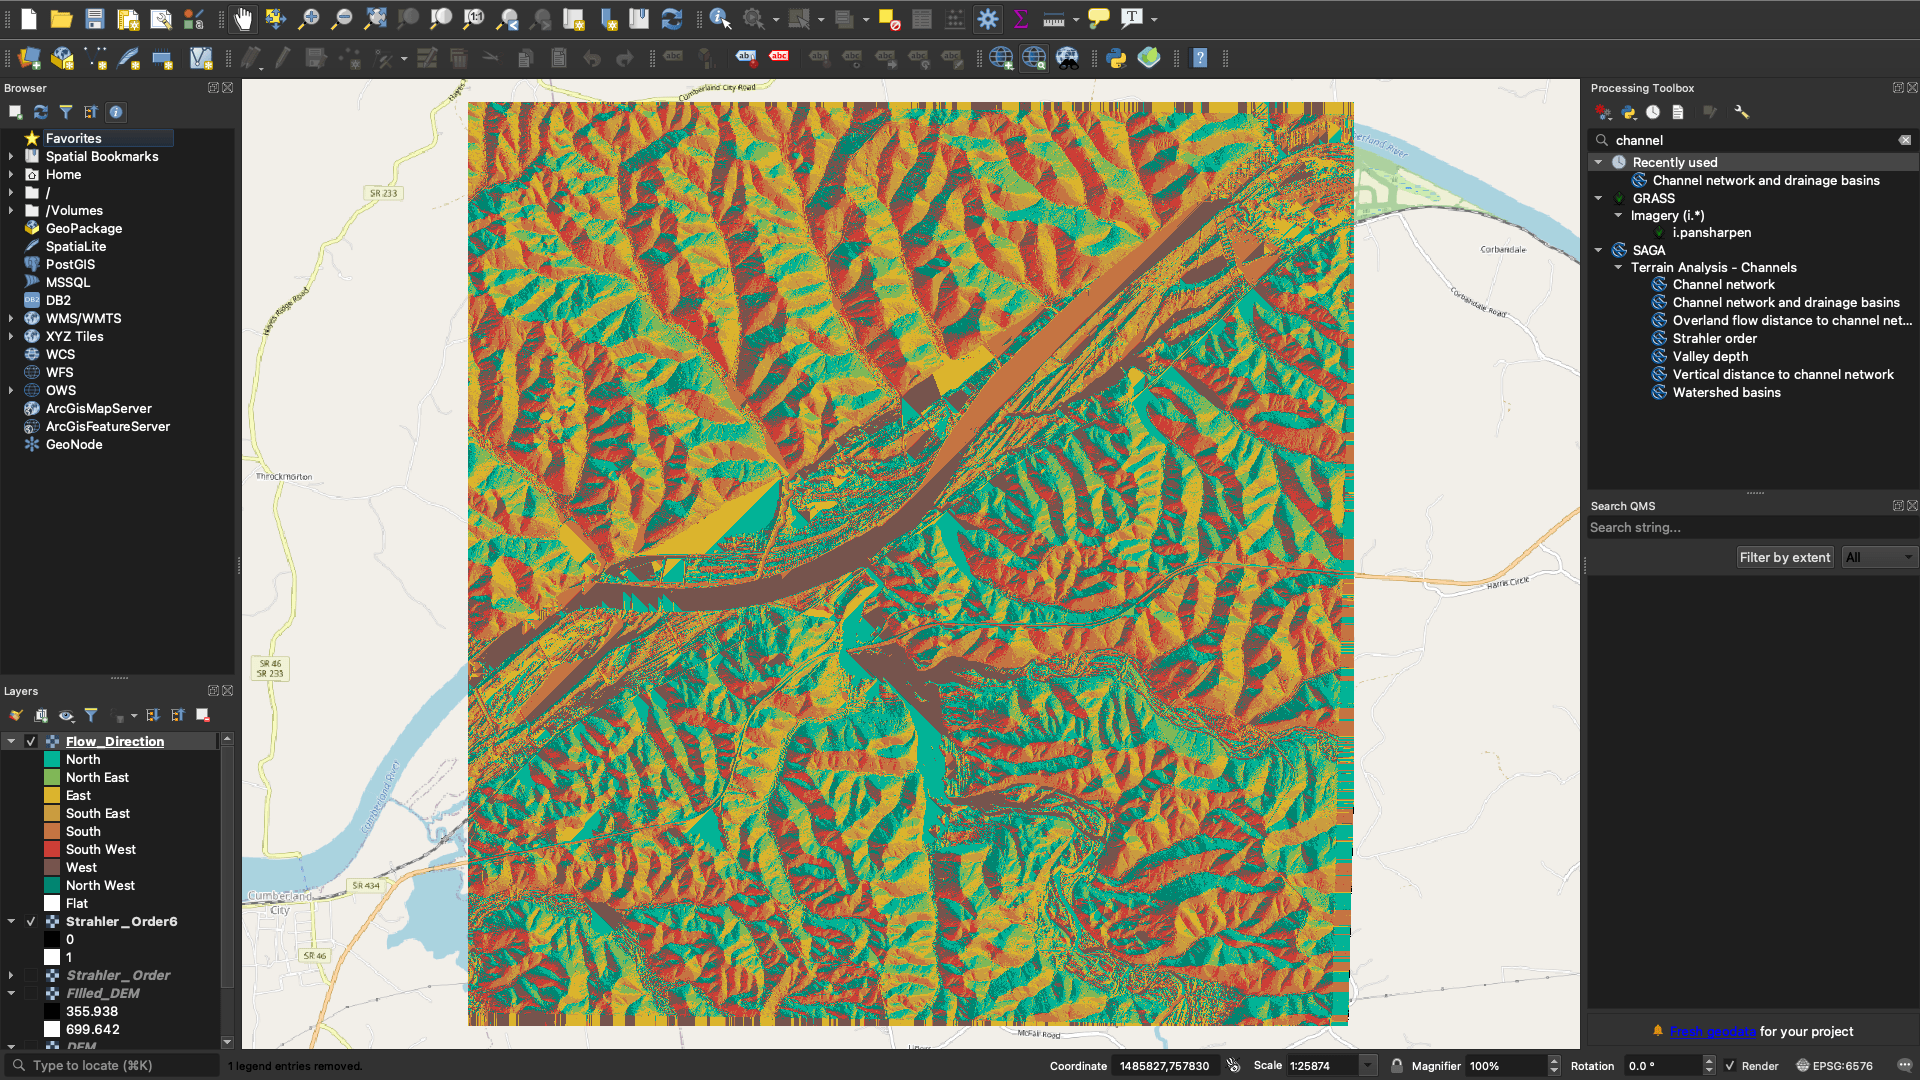
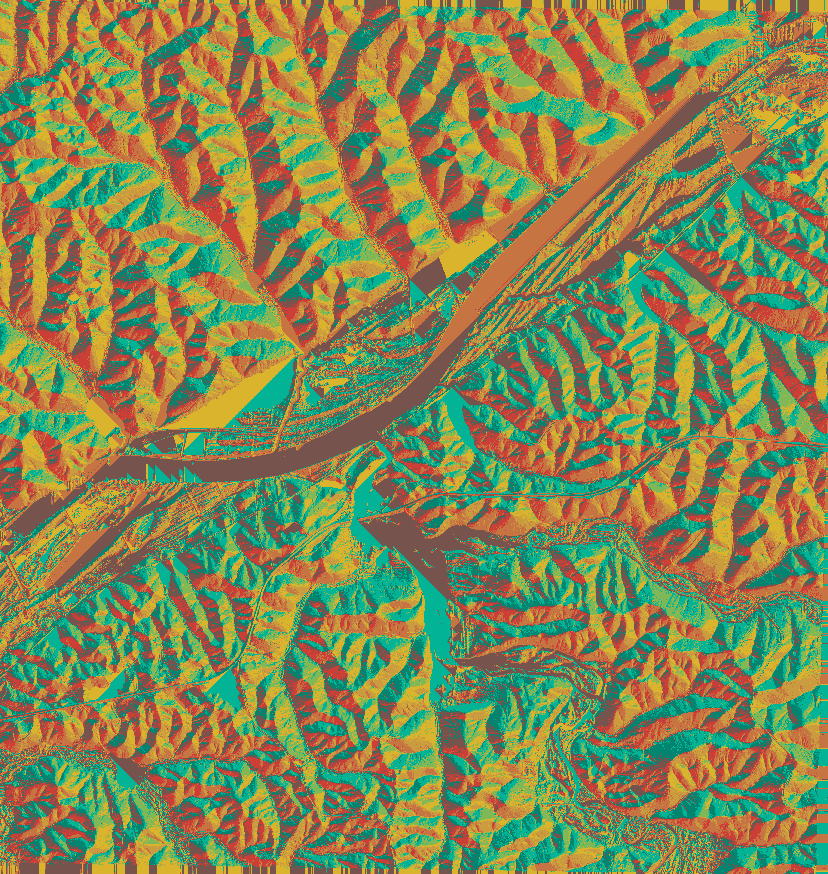
Flow_Direction with new symbology (2 image slideshow)