User Guide / Using Cross Sections in Equator
Using Cross Sections in Equator
In this tutorial, we will walk you through the following steps:
- Drawing a cross section
- Formatting a cross section
- Previewing a cross section
- Exporting a cross section
Guide
The Cross Section tool allows you to view the exact elevations of an area between two or more given points.
Drawing a cross section
Click the Cross Section tool on the sidebar. This will cause a yellow point to follow your cursor around on the map.

Left-click where you want the cross section to start, and click again to add as many points as you’d like. Right-click or press Escape when you have your desired segment(s).

If you click on the cross section, you can add new points. Hold a point and drag it, to move it around. Right-click a point to remove it.

Formatting a cross section
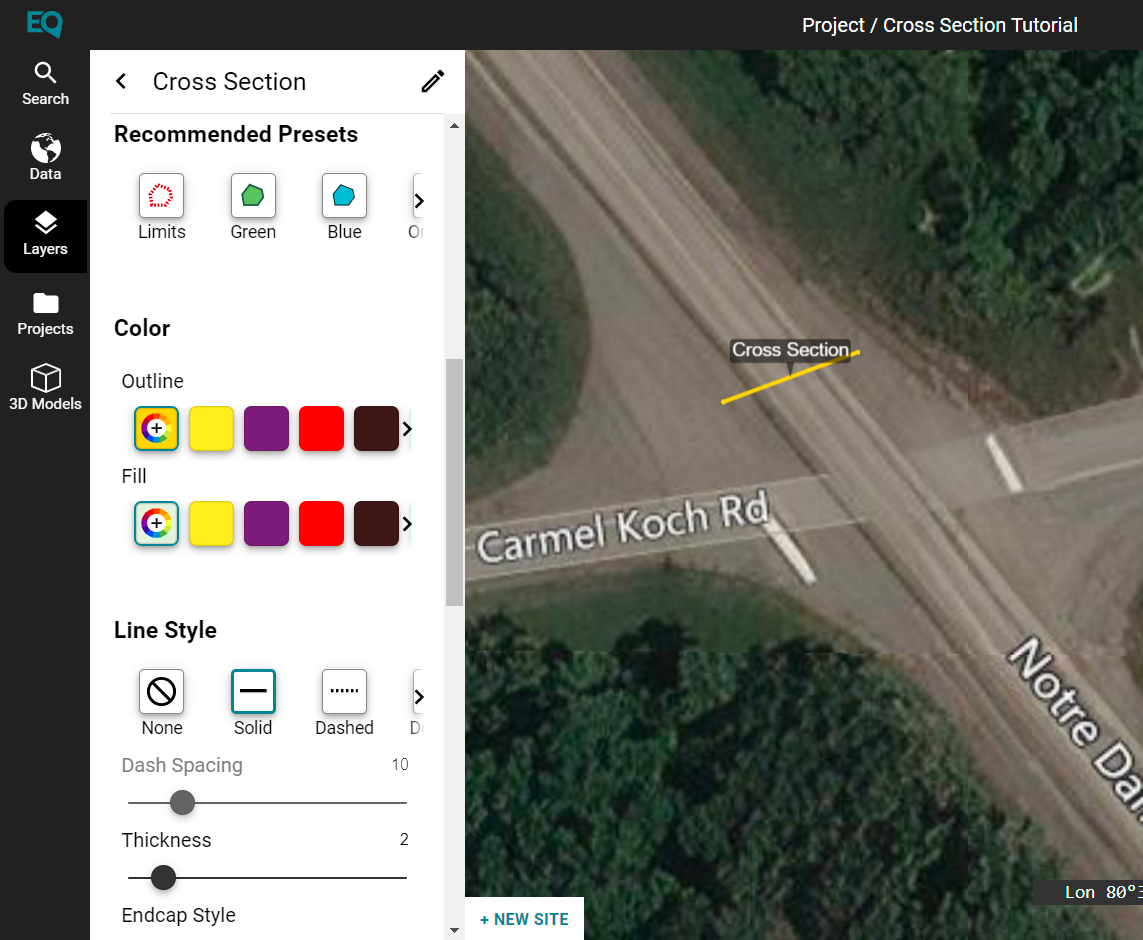
To change the appearance of a cross section, click the three dots on its label and click Inspect. This will open a menu where you can change the colour of the cross section. There are many other ways you can change the appearance of the cross section, such as the line type, line thickness, and the label for the cross section.

Previewing a cross section
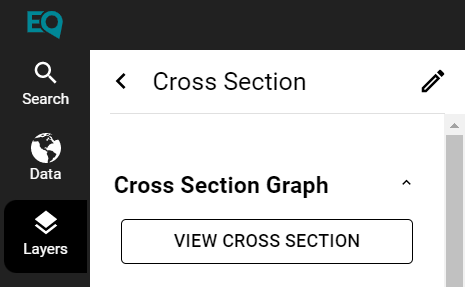
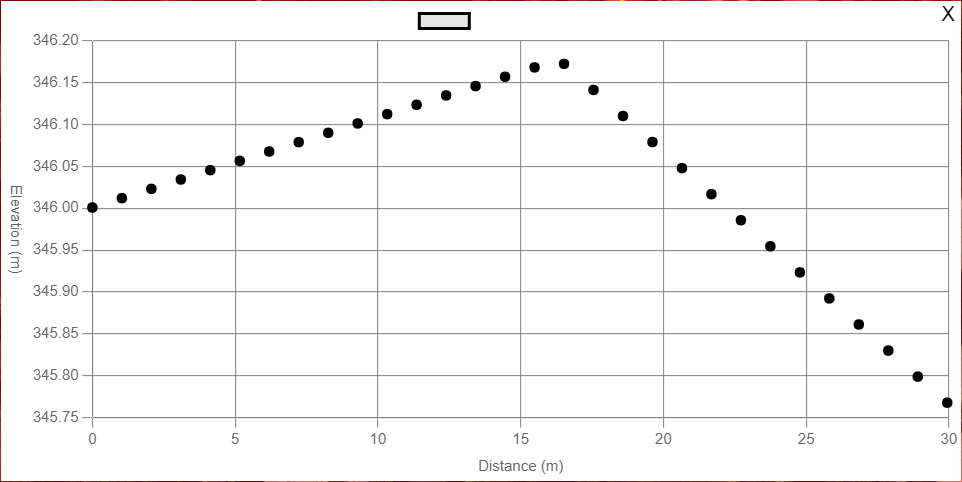
Click View Cross Section to view a graph of the elevation data. It will take a moment to process because the data is coming from millions of LiDAR points! If the cross section is longer, the time to produce the graph may take longer.

When viewing the graph, the options in the side menu under Cross Section Graph can change how the points on the graph look. Under Advanced Options, you can also change the scaling of the grid.

Deleting a cross section
Click the three dots on the label of the cross section or group you want to delete and select Delete twice.
Exporting a cross section
Note that you have to download each cross section individually.
In the layers menu, click the download icon of the cross section you want to download.
Choose your file type. Saving as a CSV will allow you to open the data in Excel spreadsheets, but you can also save it as a Shapefile or KML.
Additionally, select whether to include interpolate points. Leaving this checkbox on will produce a file with points all along the lines. Turning interpolation off will produce a file that contains only the points drawn in Equator.
You can also select a projection for your data using at EPSG code (consult EPSG.io if you’re unsure of your coordinate system.) Learn more about coordinate systems in Equator here.

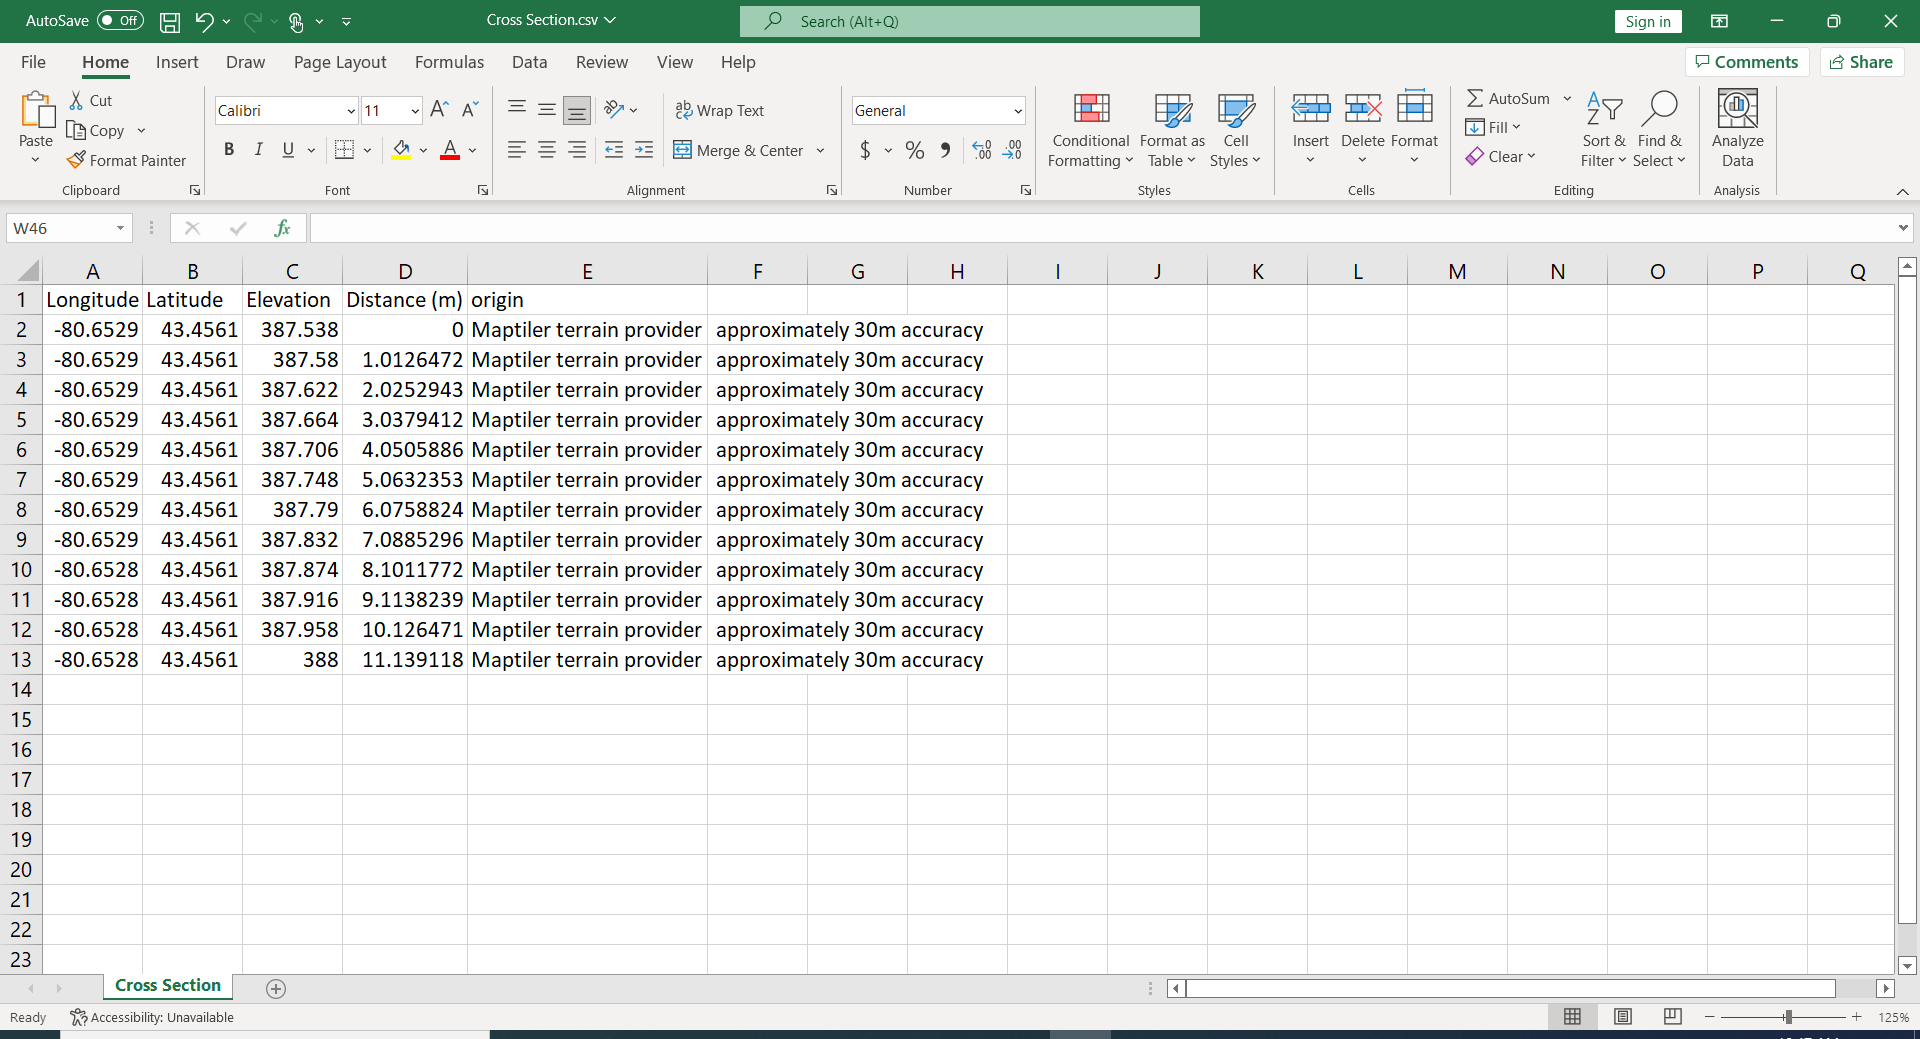
Opening the CSV file in Excel will show you the cross-section data. Each point is on a new row. The columns will tell you what the point’s coordinates are (latitude and longitude), as well as its elevation and distance from the starting point.
