
What is a Shapefile?
A shapefile is a storage format for geographic data. Shapefiles can contain lines, points, polylines and polygons that represent different features on a map.
Each shapefile must contain at least three files – .shp, .shx, and .dbf. The .shp file contains the actual geometry data (e.g. points or lines). The .shx file contains a index to find the information (kind of like a reference for looking up data). The .dbf file contains attribute information (a table with more info about each feature). The image on the left shows two shapefile layers (green “storm sewers” and red “drainage areas”).
How to Open a Shapefile?
Geographic Information Systems (GIS) software is typically required to open and view a shapefile. There are a few popular options that range from free to thousands of dollars per year. Equator is free and easy to use (no installation required), just click on “Go To Viewer” to give it a try. Other alternatives include ArcGIS, QGIS, or Google Earth.


Shapefile Examples
You can find thousands of shapefiles right in Equator – things like roads, rivers, pipes, parks, buildings. Check out this tutorial to learn how, or click “Go To Viewer” to explore on your own.
Here are a few shapefiles that you can download for reference:
Shapefile Example: Points
This shapefile marks the urban tree inventory in Boulder Colorado, managed by the department of parks and recreation. This shapefile is overlaid on Eris’s 3D terrain in the Equator app. There are over 50,000 trees documented in this dataset.


Shapefile Example: Lines
This shapefile includes bikeways in San Jose, California, overlaid on a 3D terrain base layer. Bikeways represented in this shapefile include lanes, trails and sharrows across the city.
Shapefile Example: Polygons
This shapefile outlines the five boroughs of New York City (The Bronx, Brooklyn, Manhattan, Queens, and Staten Island). Queens is the largest borough with an area of 280KM². All attribute data for the shapefile can be viewed by clicking on a specific feature.

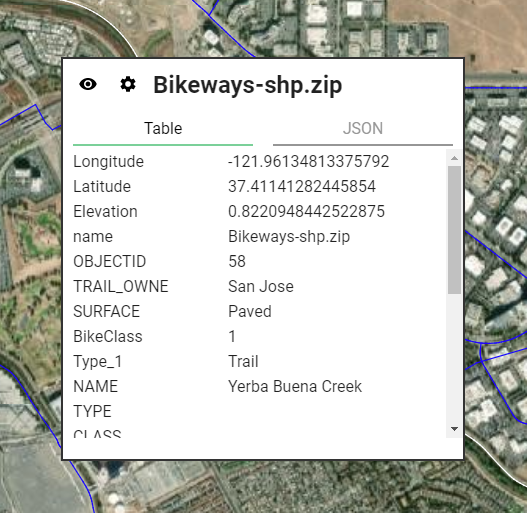
The Attribute Table
The attribute table include details about a data set and specific features, created by the data provider. Typical information provided includes coordinates, name and ID. Many providers also choose to include ancillary data such as measurements, notes and any other classifications that may be relevant to the type of data.
The attributes for all data features within a shapefile can be viewed in a summary table within Equator. You can also select an individual feature to view it’s specific attributes.