LIDAR
What is LiDAR: Getting Started Guide
10 Minute Read
This article provides answers to commonly asked questions about LiDAR (Light Detection and Ranging technology), and highlights examples of how it is used in various applications.

What is LiDAR?
LiDAR stands for Light Detection And Ranging, which uses laser pulses to measure distances. LiDAR is a type of laser scanning technology used in many fields, but most famously for mapping and self-driving cars.
What exactly does LiDAR do? Well, at its core, it measures distance using light pulses. The scanner sends out infrared laser beams in every direction and records the time it takes for each beam to be reflected back to calculate distances. This can happen up to 100 million times per second.

Airborne LiDAR (Light Detection and Ranging Technology) (Source: gisgeography.com)
Our LiDAR Products
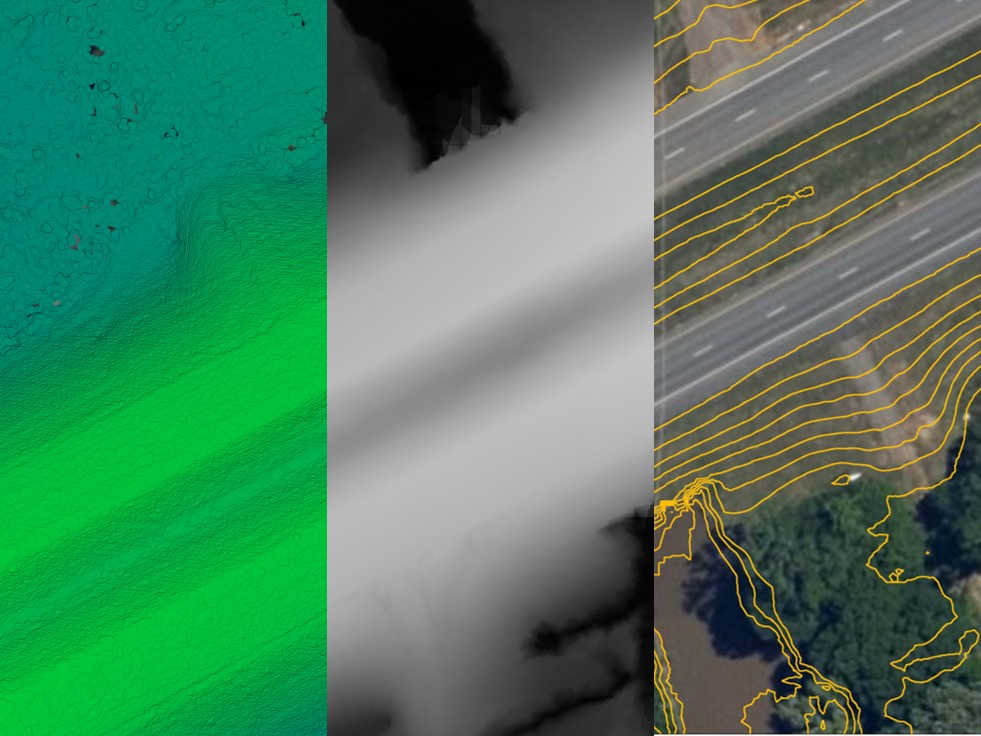
Contours
DWG, SHP Formats

DEM
GeoTIFF Format
DEM
GeoTIFF Format
How does LiDAR work?
Essentially, LiDAR pulses a laser at an object, then measures the amount of time it takes for the laser light to bounce back. By measuring the time it takes for the light to return, you can create a 3-dimensional representation of that object.
Typically, LiDAR technology requires four elements:
- An Active LiDAR Sensor: that performs as an illuminator/ designator of near-infrared laser light;
- A Scanner: or detector that receives backscattered energy from the ground;
- A GNSS device: (e.g. GPS) to assign a geographical location for each LiDAR data point in the form of x, y and z coordinates; and
- A Navigation System: An inertial navigational measurement unit (IMU), which determines the platform’s acceleration, orientation, and altitude.
Did you Know?
LiDAR is a laser.
What are aerial / airborne LiDAR surveys?
LiDAR is used for both ground (terrestrial) and aerial surveys. In the terrestrial domain, LiDAR is mounted on a tripod and or land survey equipment. This approach works well for ground activities such as roads and facility construction, mine planning, and quarrying (typically smaller geographic areas).
In contrast, aerial LiDAR survey, also known as Airborne Laser Scanning (ALS) or Airborne Laser Terrain Mapping (ALTM), is used for large geographic areas. Aerial surveys tend to use planes and drones to collect a lot of data, in a small amount of time. This method is said to be cost-effective, and its typically spatial resolution can reach up to 15 cm (Uddin, 2002).

Aerial Survey Team (Source: gov.uk)
LiDAR vs. Radar
A radar sensor emits pulses of microwave energy, while LiDAR uses near-infrared lasers.
The microwave energy has a longer wavelength when compared with the near-infrared laser. It is capable of collecting data at a significant distance, can pass through objects, and can operate under any weather condition or any part of a day. However, the use of microwave energy is problematic in the detection of small objects on Earth’s surface.
Furthermore, the microwave region is subdivided according to frequency range, and they are the Ka, K, Ku, X, C, S, L, P bands, which were named during World War II for ease of reference (Radar Basic, 2015). Bands with higher frequency can provide better spatial resolution. Comparable with LiDAR hardware’s basic components like transmitter and receiver, an additional element called antenna is installed in radar sensing and it is used to transmit microwave signals through a medium. The bigger the antenna, the higher the frequency. Below is a table that summarizes some of the separate features of LiDAR against radar.
| Description | LiDAR | Radar |
|---|---|---|
| Components | Illuminator, detector, GNSS, IMU | Transmitter, receiver, antenna |
| Waveband | Near-infrared laser (1024nm) for terrestrial
Green light for aquatic (550 nm) |
Microwave (0.3-300 GHz) |
| Advantages | Can operate both day and night.
Can penetrate through openings in a forest canopy by multiple returns per pulse and consistently measures upper elevation. Precise registration of spatial information over optical remote sensing. |
Operates under any weather condition.
Can operate both day and night. Precise registration of spatial information over optical remote sensing. |
| Physical Constraints | Highly affected by atmospheric aerosols and can operate only during good weather conditions.
Light scattering and absorption lower height values of vertical structures
|
Has wider beam diameter, which limits its detection of small objects.
Does not provide information on the detected object in terms of type and colour.
|
What is LiDAR used for?
Light detection and ranging technology is commonly used to examine and measure Earth’s features at a distance. LiDAR is especially applicable to local-scale studies of both natural and manmade features. There are endless uses cases for LiDAR, but here are some common examples:
- Land cover and land use change management;
- Water feature and quality monitoring;
- Archaeological investigation;
- Hazard mapping; and
- Detecting unidentified features on the Earth’s surface.

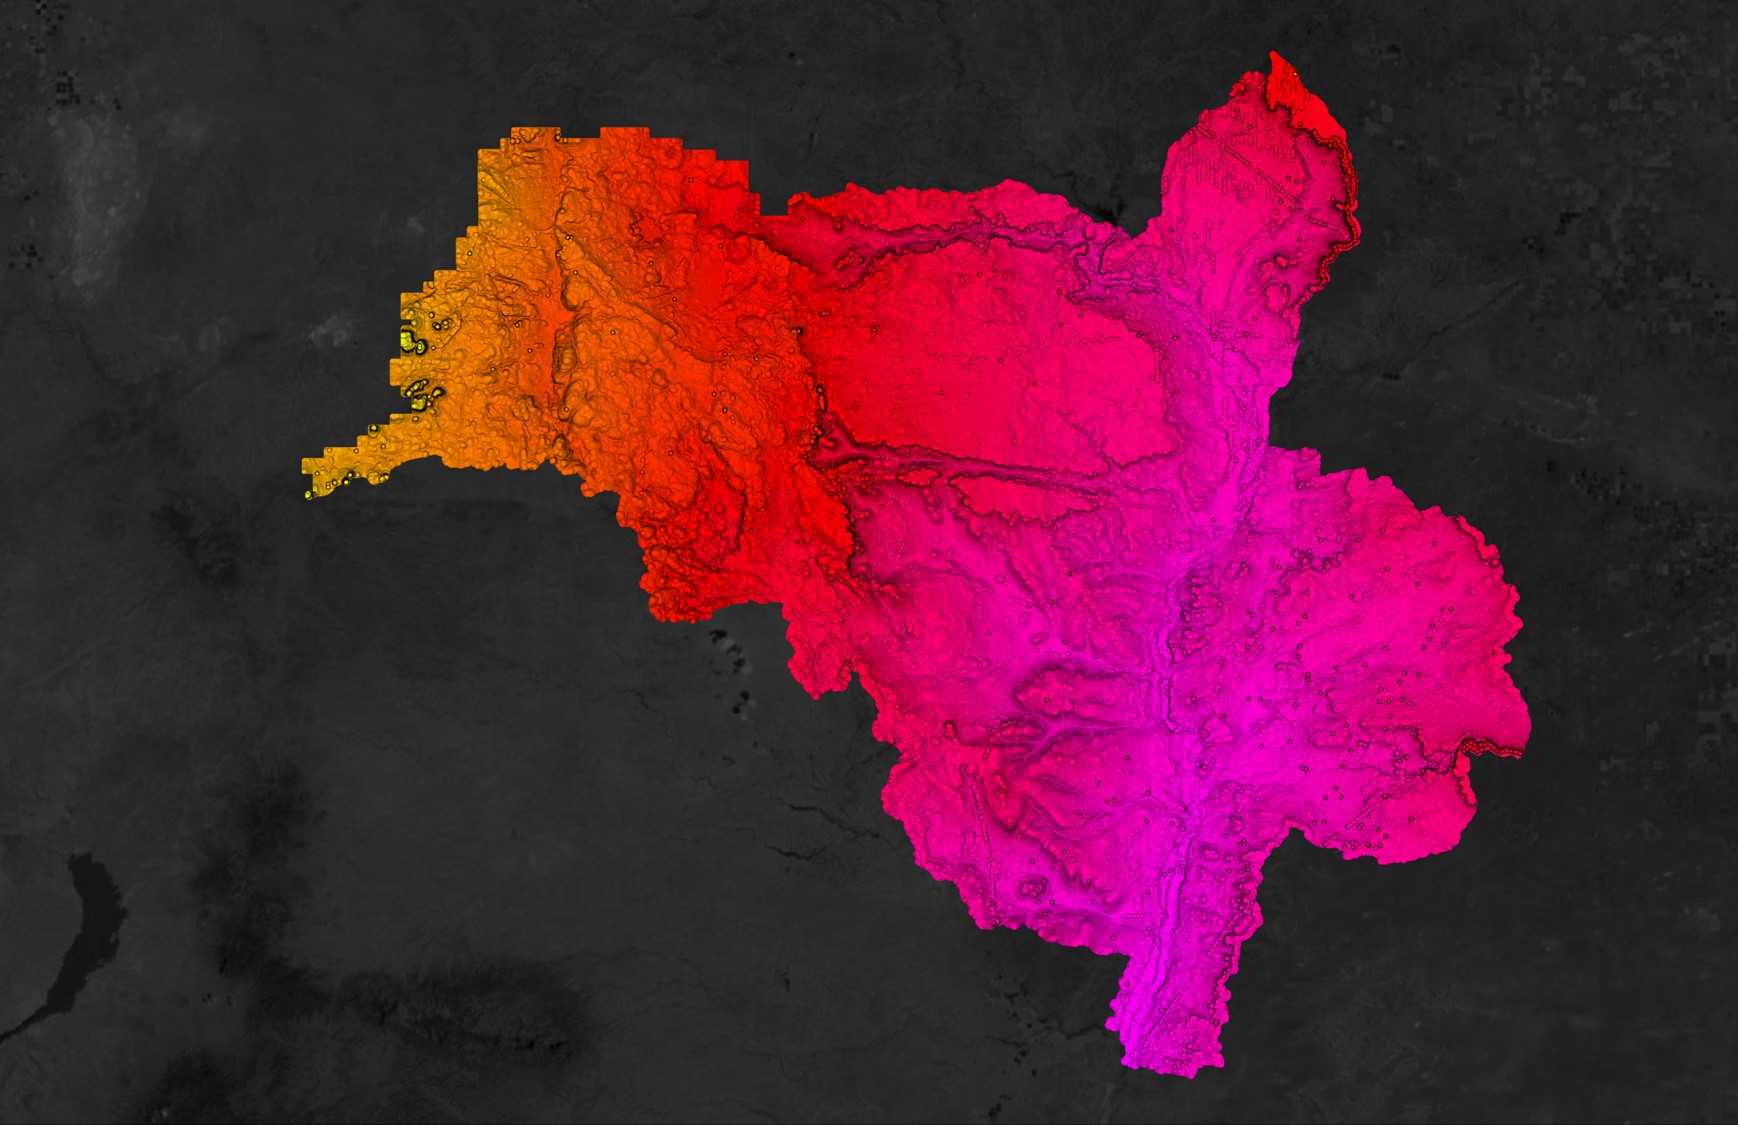
Lidar-derived image of the Mississippi River along the border of Arkansas and Mississippi, southwest of Memphis, Tennessee. (Source: Daniel Coe on flickr)
How accurate is LiDAR?
The accuracy of aerial LiDAR data varies based on the platform type, and LiDAR sensor model. In general, accuracy is proportional to the cost and age of the LiDAR sensor. The absolute accuracy for older LiDAR ranges between 15 and 30 cm while 10 to 20 cm for more recent models (Carter, Schmid, Waters, & Betzhold, 2012).
Often, LiDAR surveys are captured in flight, meaning that the LiDAR sensor is in motion. For example, when the LiDAR system is affixed to a plane or LiDAR. In these situations, the accuracy is reduced in relation to the altitude and speed of the flight. To improve the accuracy or quality check airborne LiDAR surveys, it is very common to install additional ground control points for comparison (Buczkowski, 2018).
Classical airborne LiDAR, flying at the typical altitude of 2,000 m can survey a surface area up to 1,000 km2 per flight. The average absolute horizontal accuracy is 10 cm whereas 20 cm is for the vertical accuracy.
In contrast, lightweight drones like the fixed-wing type can survey an area of 10 km2 per flight with absolute horizontal and vertical accuracies of 5 cm and 10 cm, respectively (Daneshpajooh, 2021).
LiDAR mapping project examples
In the past 10 years, there has been astonishing growth in industry research and government-funded projects involving LiDAR. Some interesting examples are highlighted below.
Currently, the Canadian Centre for Mapping and Earth Observation (CCMEO) is in the process of completing its country’s LiDAR-derived high-resolution DEM. Likewise, the agency also integrates these DEMs with deep machine learning to facilitate automated classification of DEM hydrological elements to assist in flood mapping and hydrological analyses (Bélanger, et.al., 2020).
In Denmark, the Aarhus University tested LiDAR technology in agricultural planning. The project was able to map soil properties and predict crop yield trends. This data will support the strategic use of agricultural resources like fertilizers and planning for crop arrangement (UAV LiDAR mapping for crop fields, 2018).
Field mapping using a DJI Matrice 100 and a Veldyne LIDAR at Aarhus University in Denmark
LiDAR survey is notably useful to industries that require topographic and volumetric surveys. For instance, several components of mining and quarrying activities nowadays depend on remotely sensed data for their daily operations. In open-pit mines, LiDAR-generated data provides information about environmental baseline and can be used in volume calculations of periodic material movement in mining areas.
For example, LiDAR can be used to investigate land use and land cover change around the mining tenement and discover unmonitored activities. Other applications may include environmental compliance activities like inland water quality monitoring, reforestation, and mine rehabilitation.

U.S Mine area covered UAV LiDAR mapping flight in November 2019, by Sorrell-Smith Engineering and YellowScan (Source: YellowScan)
Airborne LiDAR survey is also recognized in the urban mapping/ planning and the real estate sector. It provides information to contractors of resources available on the ground during reconnaissance, planning, pre-construction, and construction phases. It assists the project team in determining the cost of material movements such as soil stripping and required site logistics, provides a method to estimate natural resources inventory that overlaps with the project site, and offers the basis of compliance with the regulatory requirements.
In urban planning, a LiDAR survey is useful in creating a 3D model of the city. The spatial data supports city planning and helps oversee traffic flow and the construction of recreation areas and business facilities.

NYC 3-D Building Massing Model used for 3D planning (Source: NYC.gov)
Moving forward to satellite platforms, the Cloud-Aerosol LiDAR with Orthogonal Polarization (CALIOP) was tested in identifications and delineation of Arctic’s snow and sea ice covers from other surface components by observing backscatter color and depolarization ratios (Lu, et al., 2017). Another related field study was the application of an airborne LiDAR coupled with ground-based LiDARs in snow thickness measurements (Deems, et.al., 2013).
What is bathymetric LiDAR?
Bathymetric Lidar is used to measure elevations at the bottom of a water column, like the seafloor. It is an airborne LiDAR data collection technology but instead of using infrared wavelength (like LiDAR used to survey topography), bathymetric LiDAR uses green wavelength to penetrate the water column.
For clear waters, Bathymetric LiDAR can detect depth from 0.2 m up to 40 m. The horizontal and vertical accuracies are in the range of 15 cm and 2.5 m, respectively. The detection of the bottom is said to be a function of water clarity and the bottom’s reflectivity.

In 2014 a bathymetric and topographic survey conducted by boat and plane mapped the lake bed, shoreline, and watershed. (Credit: IBM Research)
Is LiDAR available to the public?
Historically, public LiDAR data was hard to access as a result of lack of data available and restrictive file sizes. The goal to make LiDAR free to public access has slowly become possible as advancements in technology make it easier and more cost effective. Similarly, the development of applications that can easily process and store LiDAR data have come a long way.
Free LiDAR data is often supported by governments and federal agencies. An excellent example is the USGS 3D Elevation Program (3DEP) with the assistance of Amazon Web Services (AWS), which provided the project’s public dataset storage (USGS, 2019).
LiDAR data that is not in the public domain can often be purchased from remote sensing data distributors.
For developers, there are open-source code packages available that are also shared by users of LiDAR technology and data. Typically, they can be found as repositories on developers’ web-based interfaces like Github, AWS CodeCommit, and Google Cloud Source Repositories.

The primary goal of USGS 3DEP is to systematically collect 3D elevation data in the form of light detection and ranging (lidar) (Source: USGS)
Where can I download LiDAR data in the United States?
Currently, the USGS LiDAR project aspires to make remotely sensed data available across the country. The 3D Elevation Program (3DEP) is an integrated effort that utilizes 3D LiDAR point clouds to map the United States and other territories. This data can now be accessed through various online platforms (USGS Platform, USGS Entwine). Data is provided in a variety of LiDAR Quality Levels, ranging from QL0 (5 cm vertical accuracy class) to QL3 (20 cm vertical accuracy class). This article explains how to download LiDAR data from the USGS Earth Explorer.
Secondly, the National Oceanic and Atmospheric Administration (NOAA) supports LiDAR and elevation data acquisition of US states near coastal areas. Its online platform is managed and accessible through the Digital Coast weblink.
Thirdly, the National Ecological Observatory Network (NEON) focus is to provide LiDAR data of the United States’ territories forming its ecosystem. It is primarily funded by the National Science Foundation and their data come in different levels of processing depending on the needs of the viewer. Level 1 products contain raw point clouds whereas level 3 products are processed raster images. Aside from LiDAR point cloud, the project also offers API and metadata for developers (National Ecological Observatory Network (NEO), n.d.). They provide a yearly repository of their LiDAR data on their data portal.
Another interesting provider is the Open Topography platform. It is a platform that compiles information on available LiDAR data across the globe. For the United States, there are 3 contributions that it presents mainly: the USGS 3DEP, data from Open Topography, and data from Community Dataspace. Aside from digital models, point cloud data can be accessed in LAS, LAZ, and ASCII formats.
There are also downloadable state-based LiDAR data like the one being maintained by the Oregon Department of Geology and Mineral Industries (Oregon Platform) and by the Washington State Department of Natural Resources (Washington Platform).
How to find USGS 3DEP LiDAR data online using the Equator platform
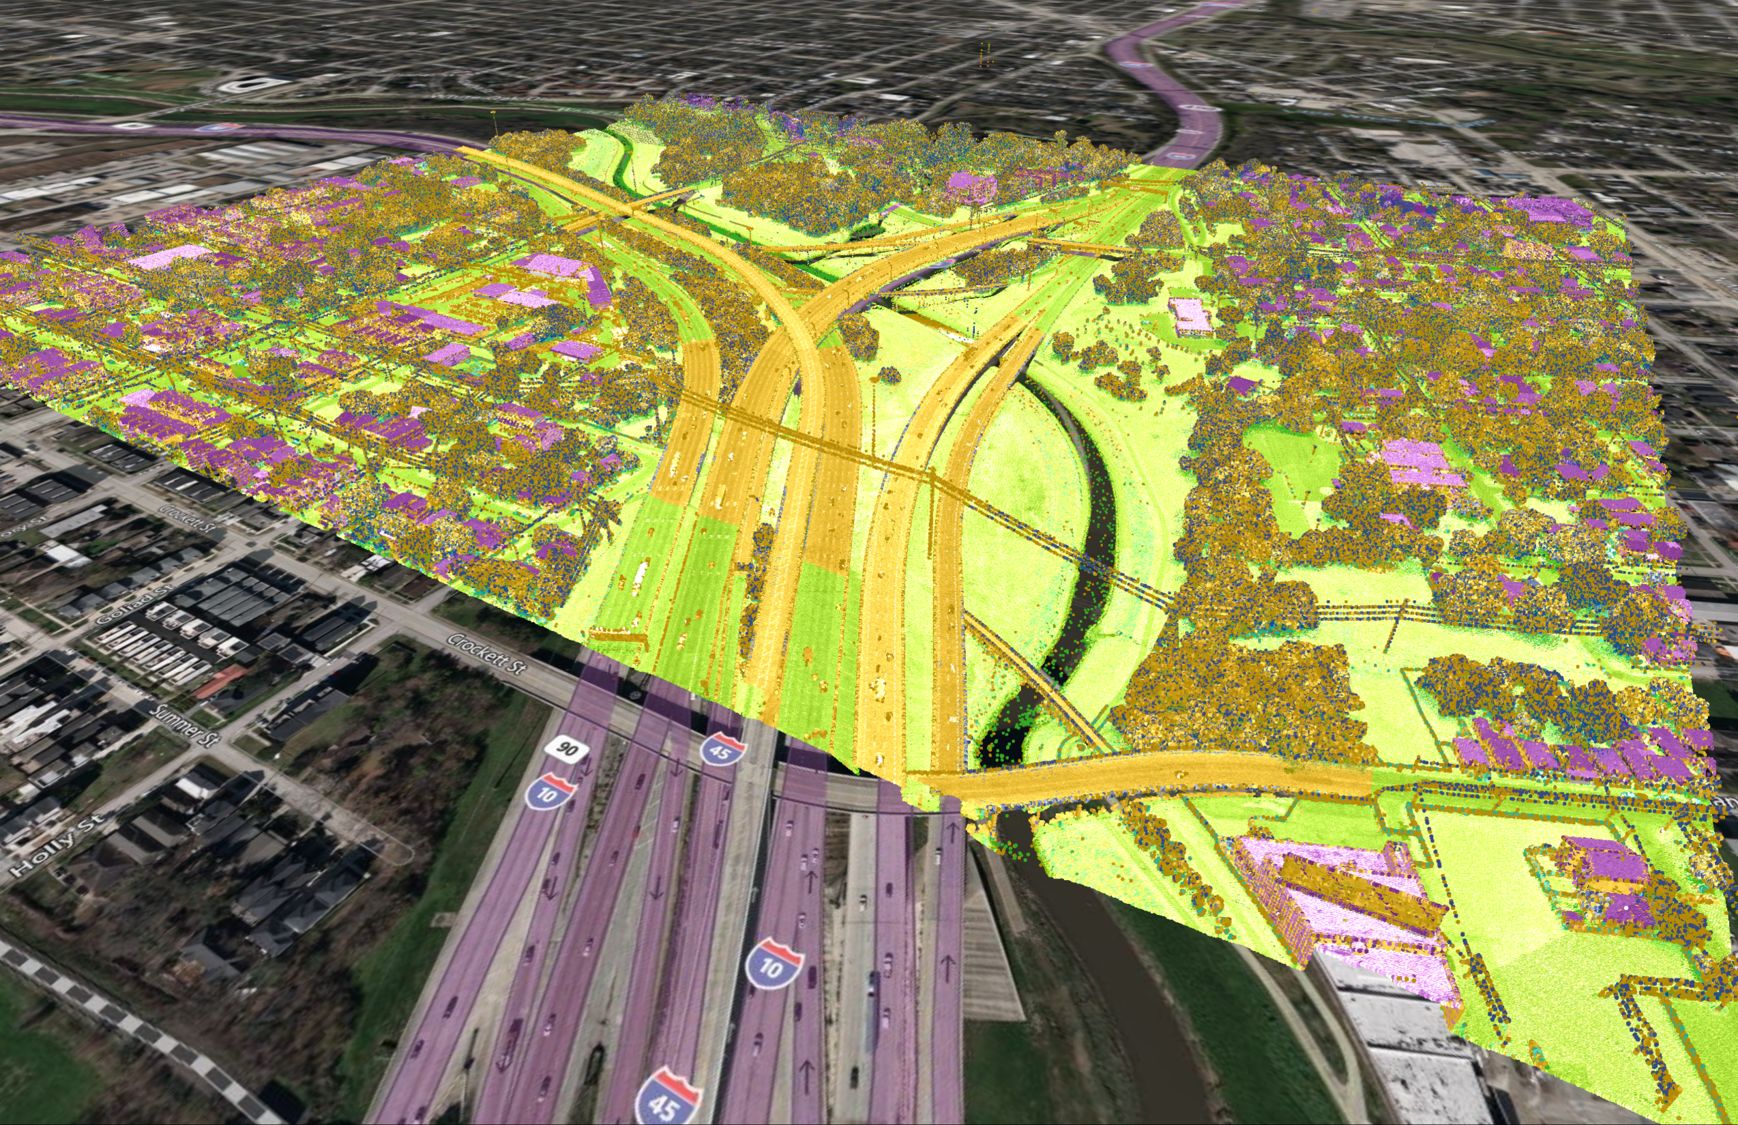
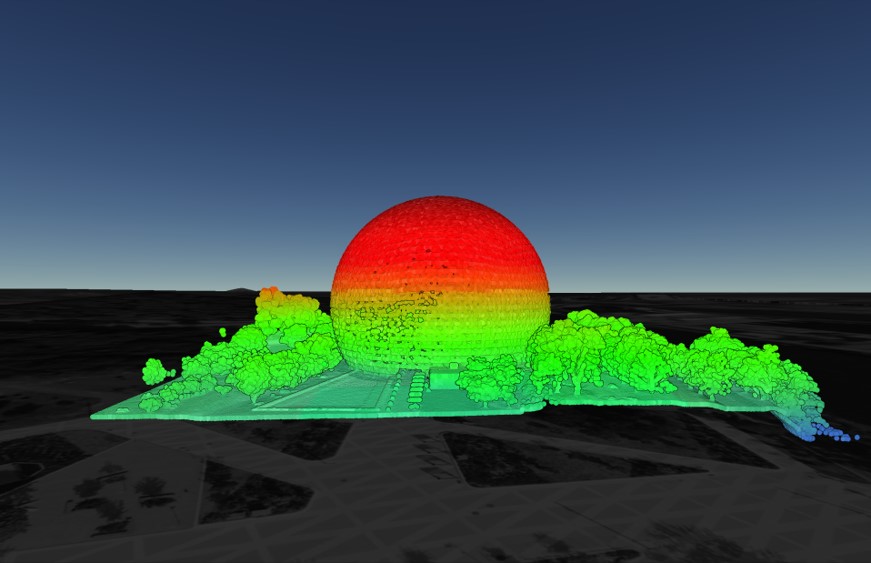
What is a LiDAR point cloud?
A LiDAR point cloud is a 3D representation of the data collected by a laser scanner. You can think of it as a virtual map, represented by a cluster of points each with an x, y and z value.
Historically, LiDAR point cloud data was stored in ASCII elevation data format. Today, this data format is no longer the standard because of a few key issues:
- There is a file security issue as the file format is accessible through basic applications like notepad;
- It does not compress lidar data, which results in even large files for minimal data volume;
- ASCII file reading and processing are slow; and
- It cannot preserve lidar-specific properties, like point classification (Laser (LAS) File Format Exchange Activities, 2019).
Today, the industry-standard file type for point cloud data is LAS(LASer) . This data format is viewable and downloadable to most GIS/CAD software.
To learn more about LiDAR data formats and products, check out this article.

LiDAR data sourced using Equator, check out the LiDAR Coverage Map to see if LiDAR is available in your area
LAZ vs LAS
The standard file type for point cloud data is LAS. LAZ Lidar data format is the compressed version of the LAS file. For circumstances where LAS has a significant file size, it is compressed to make file transfer more convenient and efficient.
There are several open-source tools for its conversion to basic LAS file format such LAStool, LASzip, and las2las. There are also conversion functions that are integrated with different GIS and remote sensing software and R Statistical application. The choice of converter depends on their reliability, availability of commands to make geographical and spatial changes over the raw data, flexibility to convert LAS data into other formats such as raster and vector. Some interesting open-source software and viewer options include CloudCompare, plas.oi, and PointVue.
Lidar mapping software examples
Selecting the most compatible software for your lidar data processing typically relies on industry or personal preferences. There are different packages each software may offer and there is a reasonable difference between open-source and paid applications. Therefore, it is best determined by your final job requirements.
Some of the open-source software has been upgraded and can now manage Lidar data without the need to undergo a file conversion. A good illustration of this development is the new QGIS 3 open-source application starting from version 3.18 and onwards. It is now designed to handle lidar point cloud data into different 2D and 3D visualization modes based on the available point attributes. Likewise, it can now accept both LAS and LAZ point cloud formats. On the other hand, its developer team and contributors are continuously working on coding functions for spatial analysis (Viewing Point Clouds – QGIS, n.d.).
Another interesting open-source software is the Whitebox Geospatial Analysis Tools (GAT). In general, it is not the typical mapping software but provides back-end features that support other GIS software. It has features that authorize users to transform LAS files into different DEM forms like a bare-earth DTM or a DSM for forest canopies. Its point cloud data viewing is currently limited to 2D projection. In contrast, its advanced extensions associated with lidar, and remote sensing can be accessed at a cost, but you can try them for free for a limited period. Some of the interesting functions include spatial analyses like point cloud contours generation, lidar segmentation and interpolations, las data conversion into different formats like ASCII and shapefiles, and point cloud data cleansing (5 Best Free LiDAR Software Tools and Applications, 2021).
The GrassGIS is another open-source GIS tool that is also dedicated to both platform users and developers. The software is excellent in executing lidar data binning and grid-based decimation. In lidar data analysis, binning is significant to determine point density on every raster data (Petras, Petrasova, Jeziorska, & Mitasova, 2016). Subsequently, the software has other executable functions for point cloud file conversion, and flood simulation, and hydrological analyses using DEMs.
Other open-source tools include Fugro Viewer and Plas.io provide services on navigating 2D and 3D Lidar data. In contrast, open-source software that depends heavily on coding requires LAS data format to be converted into raster and vector formats, respectively. After such, you have flexible navigation of these spatial data. Furthermore, Open Mapper can process LAS, LAZ, and e57 lidar file formats. e57 format stores components of point cloud data but does not include information about projection (LiDAR Formats, 2020).
ArcGIS Pro is an excellent paid software if you want to navigate and process lidar data and use advanced GIS applications as well. It provides diversified functions like spatial analysis, use of different classification algorithms, interpolation to generate terrain datasets, and image orthorectification. Moreover, the software offers a function that delineates data area out of the raw lidar points, creation of intensity images, and the ability to update attributes of selected lidar datasets. Once point cloud data is converted into raster format, you can further utilize image processing like mosaicking, orthorectification, and volume estimation.
Looking forward to paid software, ENVI offers incredible processing tools for lidar data. It has this ENVI LiDAR, which is already integrated with the main program. It is easy to use and provides comprehensive lidar-specific functions as the software is exclusively created for remote sensing imagery and spatial analyses. Moreover, it also provides an algorithm for tree extraction.
Finally, you may consider viewing LiDAR online using Equator’s LiDAR viewer.
Equator LiDAR Tools and Resources
- LiDAR Viewer – Application for viewing and finding LiDAR data online
- LiDAR Data Types – Blog post on the difference between lidar, DEM, and contours
- Equator Elevation Products – Blog post on the different elevation products that can be accessed using Equator
- Equator User Guide – Full user guild on how to get started using Equator
- Quick Overview – 2-minute video on how to get started using elevation data (including LiDAR) in Equator
- Access USGS LiDAR data using Equator – Application for viewing and downloading LiDAR from the USGS 3DEP
References
3D Elevation Program (3DEP). (n.d.). Retrieved from USGS: https://www.usgs.gov/core-science-systems/ngp/3dep/what-is-3dep?qt-science_support_page_related_con=0#qt-science_support_page_related_con
5 Best Free LiDAR Software Tools and Applications. (2021, October). Retrieved from GISGeography: https://gisgeography.com/LiDAR-software-tools/
Bélanger, D., Papasodoro, C., Turgeon-Pelchat, M., Proulx-Bourque,, J.-S., & Vachon, C. (2020). National Elevation Data Strategy Update, July 2020.
Buczkowski, A. (2018). Drone LiDAR or Photogrammetry? Everything you need to know. Retrieved from GEO Awesomeness: https://geoawesomeness.com/drone-LiDAR-or-photogrammetry-everything-your-need-to-know/
Carter, J., Schmid, K., Waters, K., & Betzhold, L. (2012). LiDAR 101: An Introduction to LiDAR Technology, Data, and Application. United States: NOAA COastal Services Center.
Choosing the perfect drone for LiDAR mapping. (2019). Retrieved from YellowScan: https://www.yellowscan-LiDAR.com/knowledge/choosing-the-perfect-drone-for-LiDAR-mapping/
Combrink, A. (2011, June). Introduction to LiDAR-based aerial surveys (Part 2). Retrieved from ee publishers: https://www.ee.co.za/wp-content/uploads/legacy/posit11/posit-jun11-p20-24.pdf
Daneshpajooh, E. (2021). Introduction to drone technology particularly in agriculture application, (Sensors).
Deems, J. S., Painter, T. H., & Finnegan, D. C. (2013). LiDAR measurement of snow depth: a review. Journal of Glaciology, 59(215). doi:doi:10.3189/2013JoG12J154
Drone Types: Multi-rotor vs fixed-wing vs single rotor vs hybrid VTOL. (2016, June). Retrieved from AUAV: https://www.auav.com.au/articles/drone-types/
Dubovik, O., Schuster, G. L., Xu, F., Hu, Y., Bösch, H., Landgraf, J., & Li, Z. (2021, February 24). Grand Challenges in Satellite Remote Sensing. 2. doi:10.3389/frsen.2021.619818
Gatziolis, D., & Andersen, H.-E. (2008). A Guide to LiDAR Data Acquisition and Processing for the Forests of the Pacific Northwest. Portland: United States Department of Agriculture.
LAS Point Cloud Format. (2021, May 5). Retrieved from United States Naval Academy (USNA): https://www.usna.edu/Users/oceano/pguth/md_help/html/las_format.htm
Laser (LAS) File Format Exchange Activities. (2019). Retrieved from ASPRS, The Imaging & Geospatial Information Society: https://www.asprs.org/divisions-committees/LiDAR-division/laser-las-file-format-exchange-activities
LiDAR Formats. (2020, July 22). Retrieved from MacOdrum Library: https://library.carleton.ca/guides/help/LiDAR-formats
Lu, X., Hu, Y., Liu, Z., Rodier, S., Vaughan, M., Lucker, P., . . . Pelon, J. (2017). Observations of Arctic snow and sea ice cover from CALIOP LiDAR instruments. Remote Sensing of Environment, 248-263.
Lukas, V., & Baez, V. (2021). 3D Elevation Program—Federal best practices. U.S. Geological Survey. doi:https://doi.org/10.3133/fs20203062.
Montgomery, J., Brisco, B., Chasmer, L., Devito, K., Cobbaert, D., & Hopkinson, C. (2019, January 16). SAR and LiDAR Temporal Data Fusion Approaches to Boreal Wetland Ecosystem Monitoring. MDPI remote sensing, 11(161). doi:10.3390/rs11020161
National Ecological Observatory Network (NEO). (n.d.). Retrieved from Data Portal: https://www.neonscience.org/data
Parker, M. (2017). Chapter 18 – Radar Basics. In Digital Signal Processing 101 (Second Edition) (pp. 231-240). Newnes. doi:https://doi.org/10.1016/B978-0-12-811453-7.00018-4
Petras, V., Petrasova, A., Jeziorska, J., & Mitasova, H. (2016). Processing UAV and LiDAR Point Clouds in Grass GIS. Remote Sensing and Spatial Information Sciences, 945-952.
Radar Basic. (2015, November 23). Retrieved from Government of Canada: https://www.nrcan.gc.ca/maps-tools-and-publications/satellite-imagery-and-air-photos/tutorial-fundamentals-remote-sensing/microwave-remote-sensing/radar-basics/9355
Shanley, C. S., Eacker, D. R., Reynolds, C. P., Bennetsen, B. M., & Gilbert, S. L. (2021). Using LiDAR and Random Forest to improve deer habitat models in a managed forest landscape. Forest Ecology and Management, 499. doi:https://doi.org/10.1016/j.foreco.2021.119580
Shi, Y., Wang, T., Skidmore, A. K., & Heurich, M. (2020). Improving LiDAR-based tree species mapping in Central European mixed forests using multi-temporal digital aerial colour-infrared photographs. International Journal Application of Earth Observation Geoinformation.
Terrestrial LiDAR and forest monitoring. (2020, July 27). Retrieved from Government of Canada: https://www.nrcan.gc.ca/our-natural-resources/forests-forestry/sustainable-forest-management/measuring-reporting/forest-inventory/terrestrial-LiDAR-and-forest-monitoring/13427
UAV LiDAR mapping for crop fields. (2018). Retrieved from Computer Vision and Biosystems Signal Processing Group: https://vision.eng.au.dk/future-cropping/uav_LiDAR/
Uddin, W. (2002). Evaluation of Airborne LiDAR Digital Terrain Mapping for Highway CorridorPlanning and Design. ISPRS Commission I/FIEOS 2002 Conference Proceedings.
USGS 3DEP LiDAR Point Cloud Now Available as Amazon Public Dataset. (2019, February 7). Retrieved from United States Geological Survey (USGS): https://www.usgs.gov/news/usgs-3dep-LiDAR-point-cloud-now-available-amazon-public-dataset
Viewing Point Clouds – QGIS. (n.d.). Retrieved from Points North GIS: https://www.pointsnorthgis.ca/blog/viewing-point-clouds-qgis/
What is LiDAR and what is it used for? (2021). Retrieved from American Geosciences Institute: https://www.americangeosciences.org/critical-issues/faq/what-LiDAR-and-what-it-used


Leave A Comment