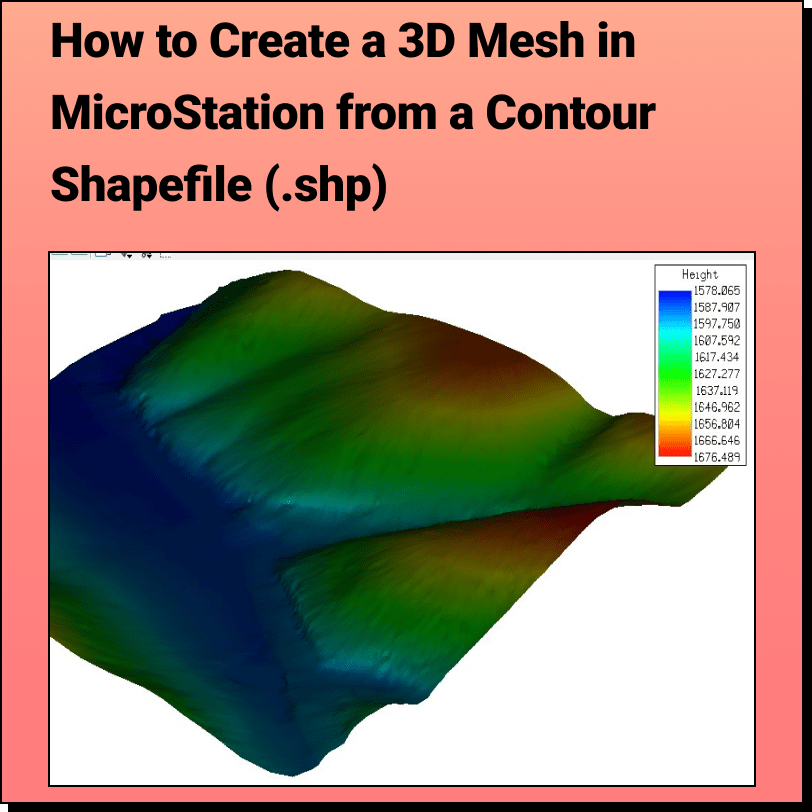
Tutorial: Creating a 3D Mesh from a Contour Drawing in Bentley MicroStation
In this tutorial, learn how to create a 3D surface mesh in MicroStation from a topography or contour drawing file (.dwg file) exported from Equator
Step 1: Source a contour drawing file
Step 2: Import drawing file (.dwg) into MicroStation and create 3D mesh
Find your site’s topographic data at Equator, export it as a Drawing File (.dwg) and create a 3D Mesh Surface in MicroStation
Step 1: Source Contour Drawing File
If you already have a topography or contour drawing file (.dwg), you can skip down to Step 2. If you need a contour drawing file, follow the steps below to generate a .dwg file using Equator.
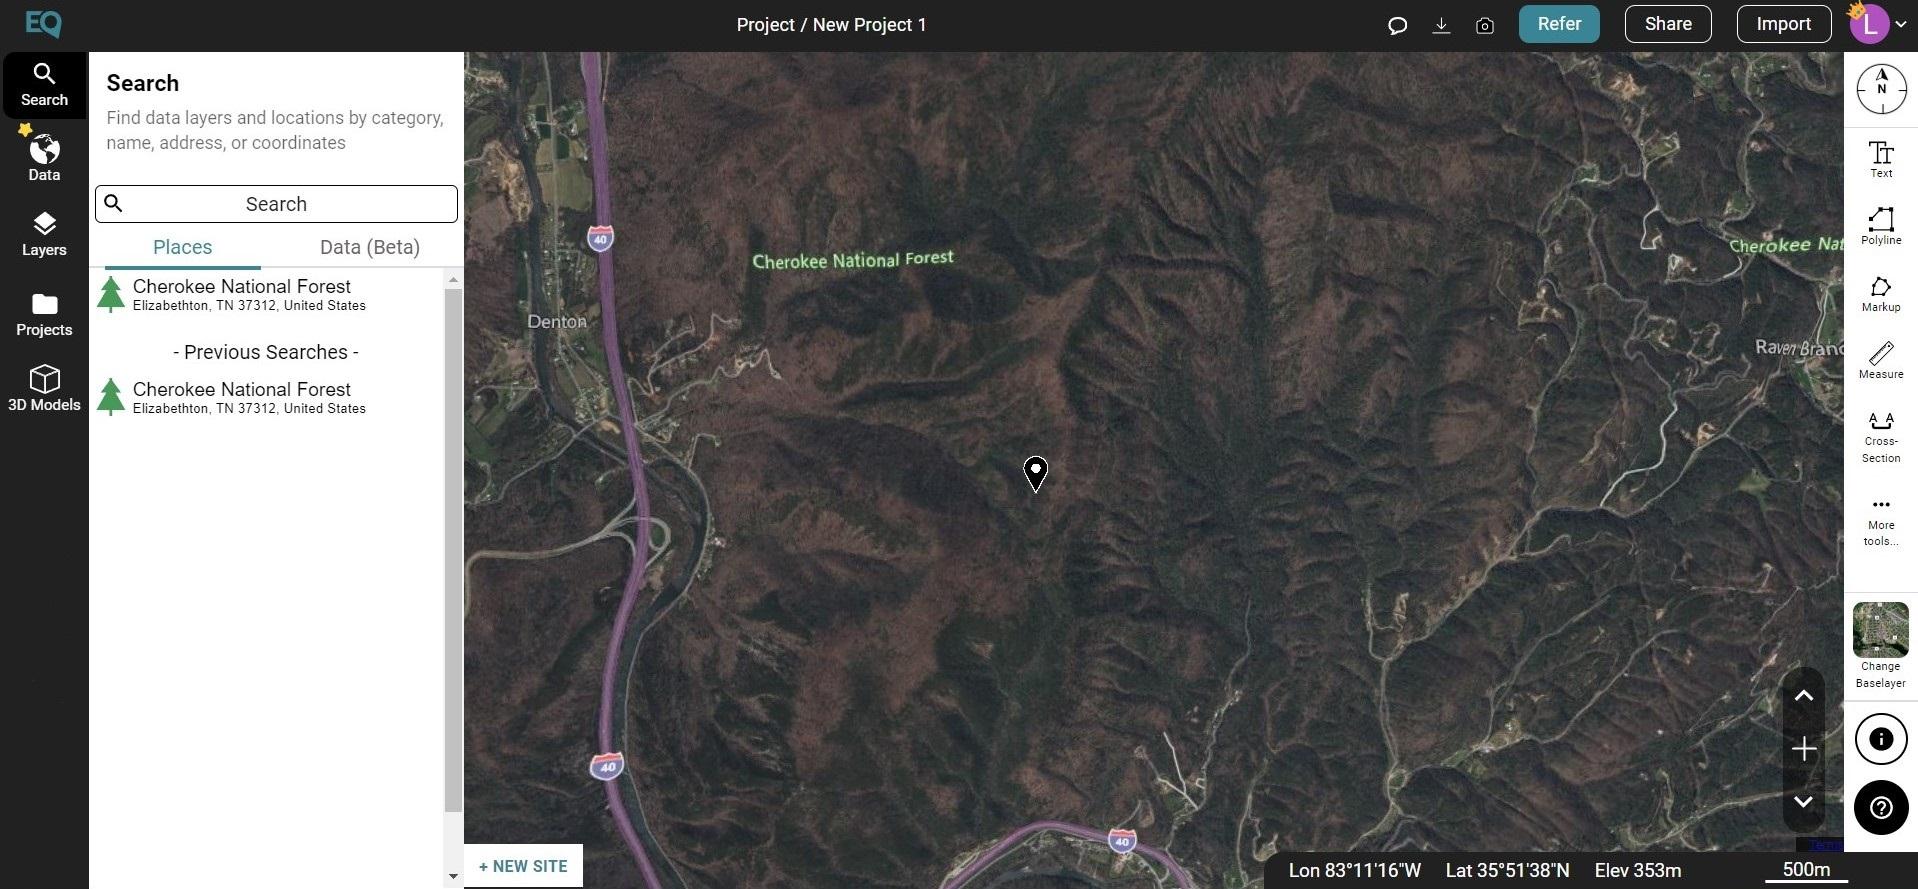
- Locate your project site by using the Search tab or simply zooming into your site.
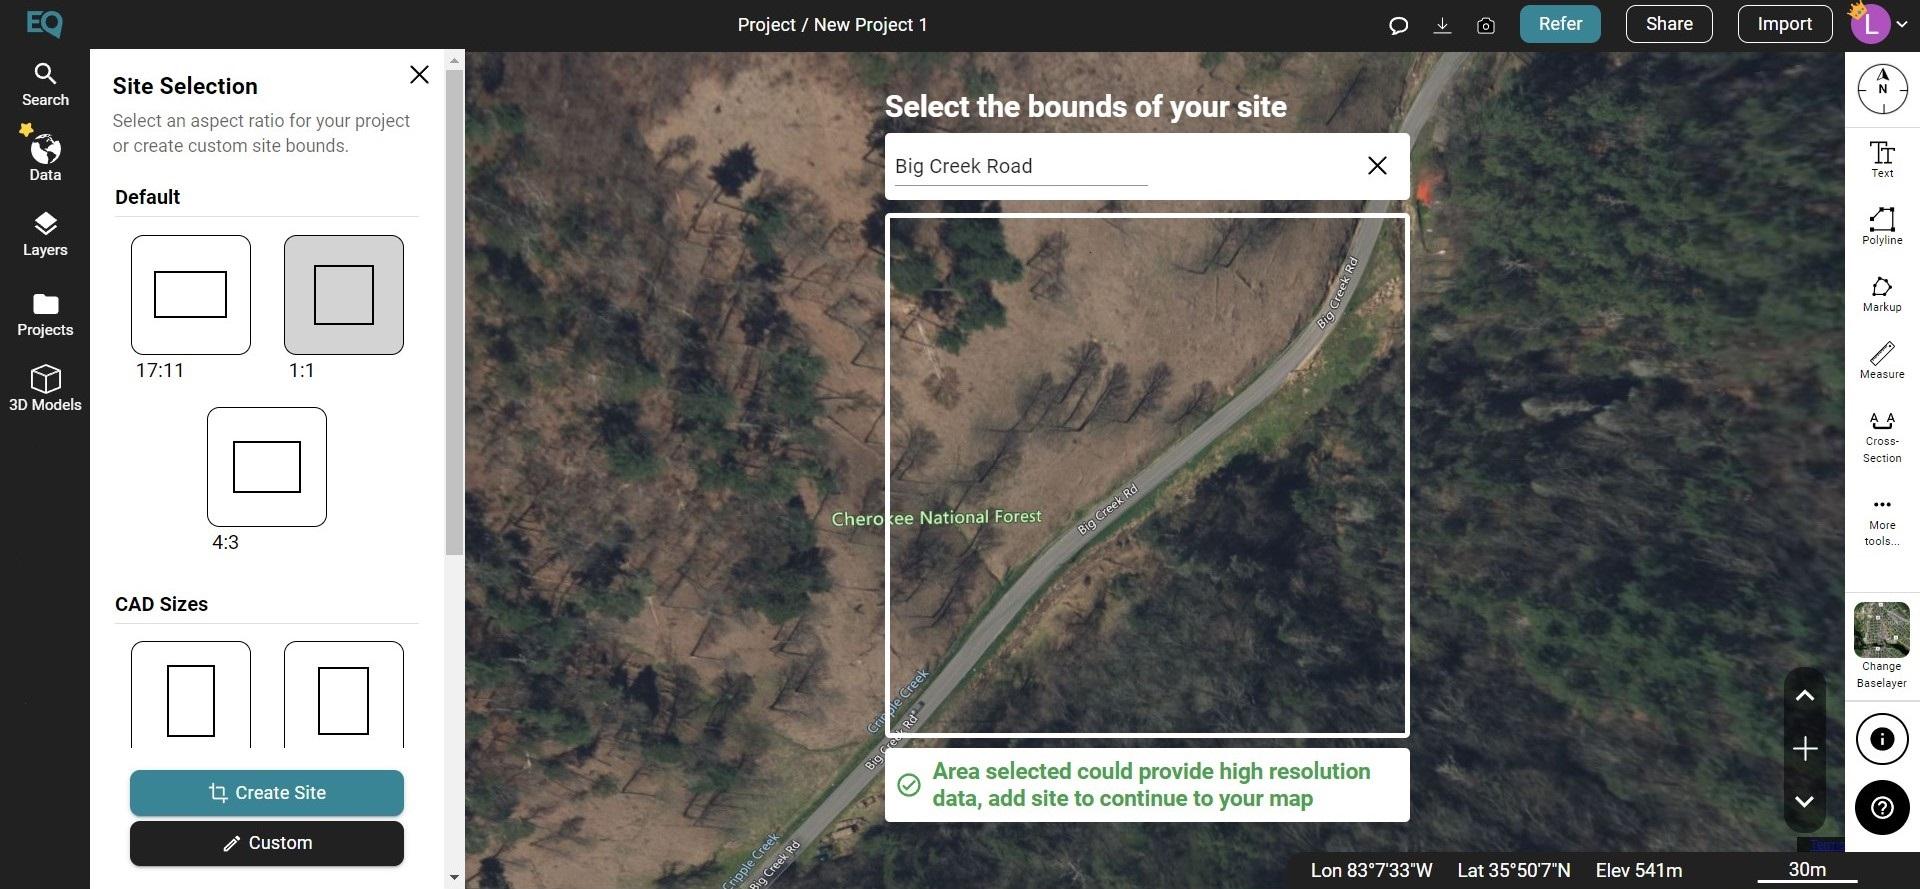
- Create your site boundaries by clicking on the +NEW SITE button on the bottom left of the screen. Use one of the predefined boundary boxes or create a custom boundary. Don’t forget to name your project site.
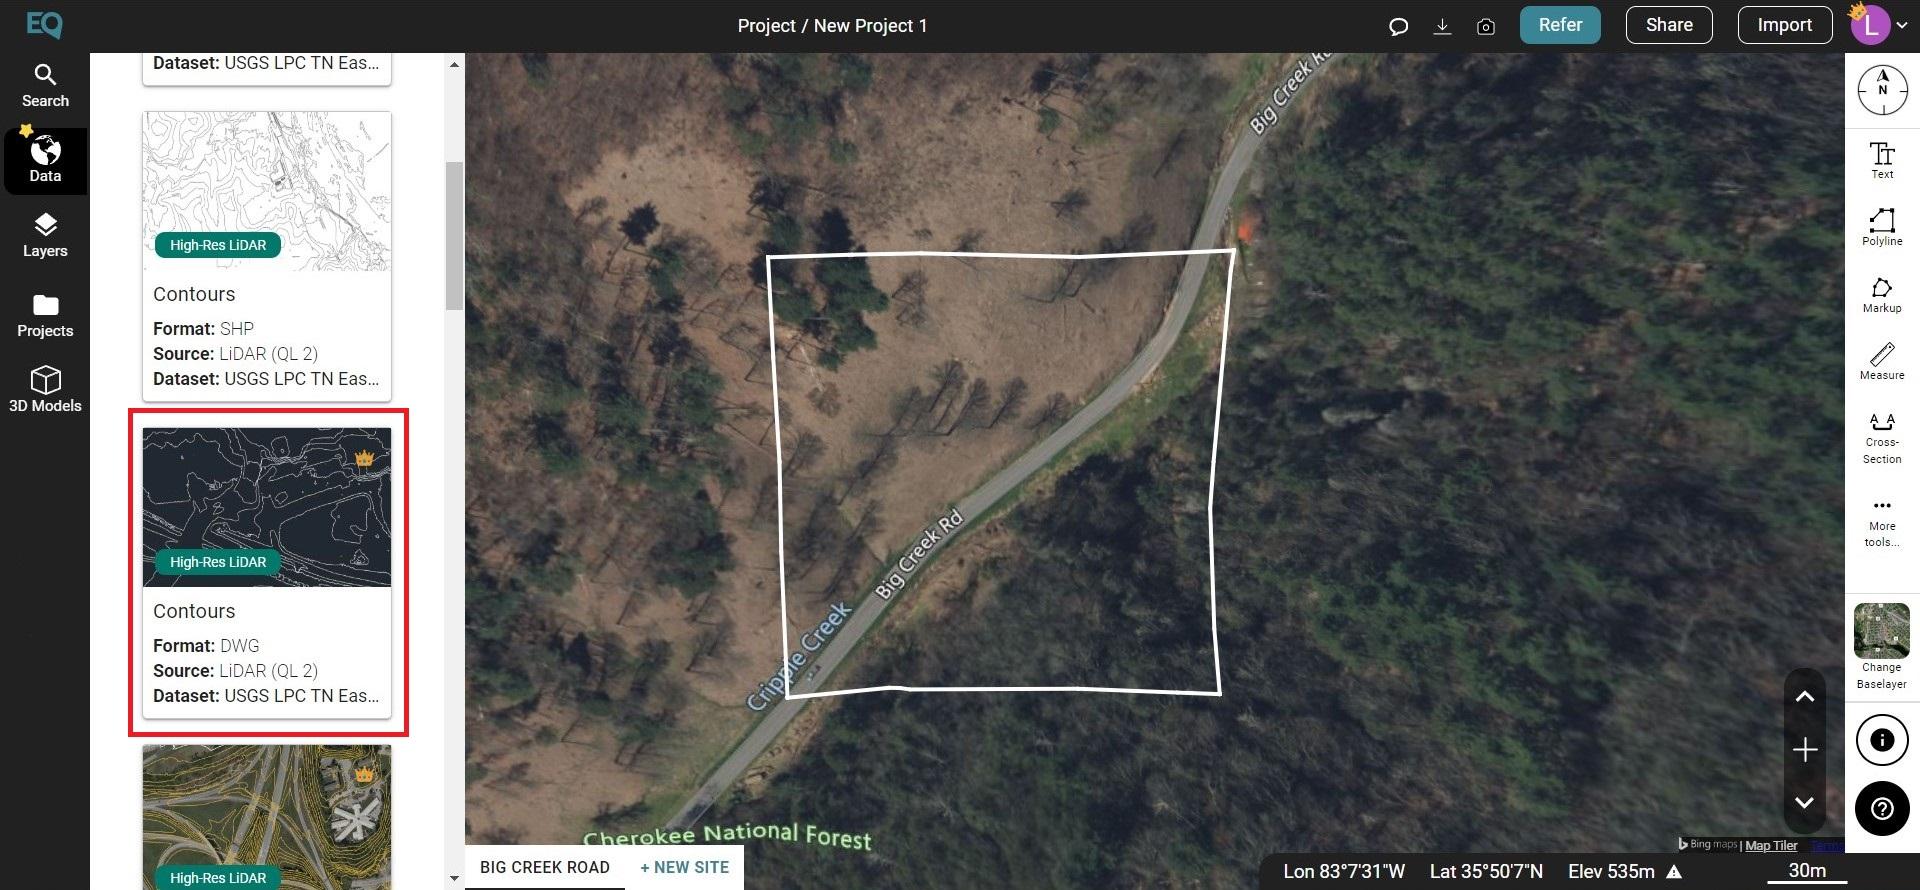
- Under the Data tab, click on the Contours (Format: DWG) option.
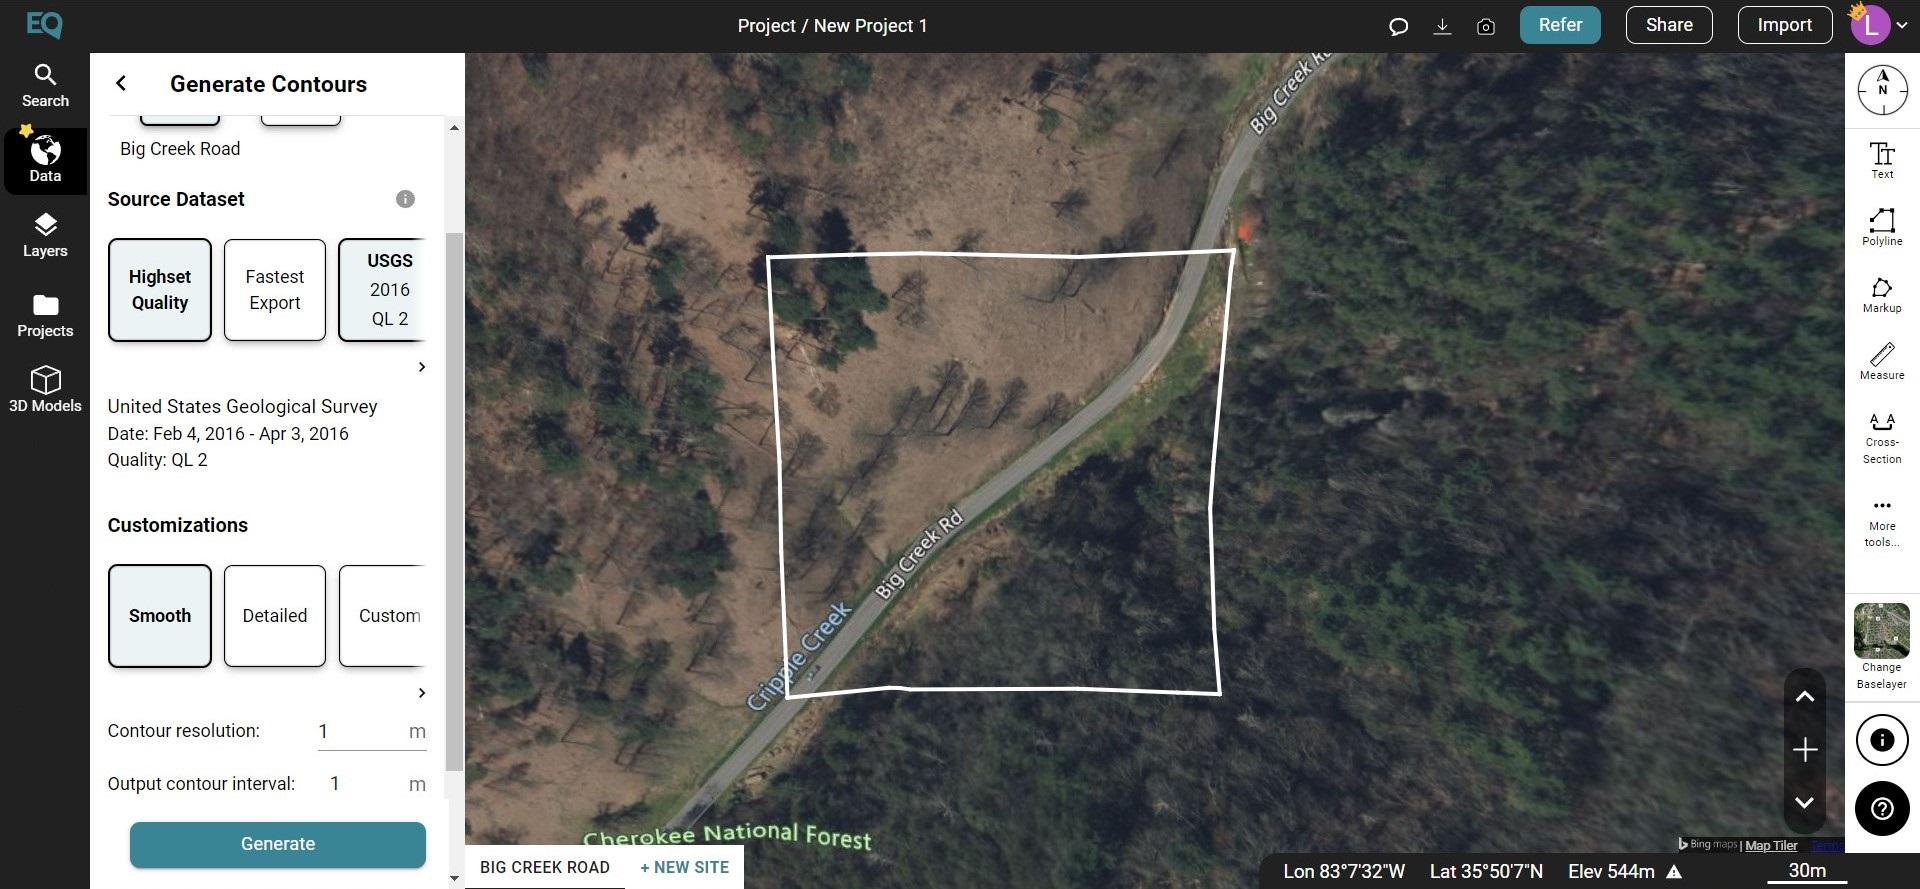
- The Contours dialog box will appear. Select your project site, source dataset and any customizations such as contour resolution and interval. Then click Generate.
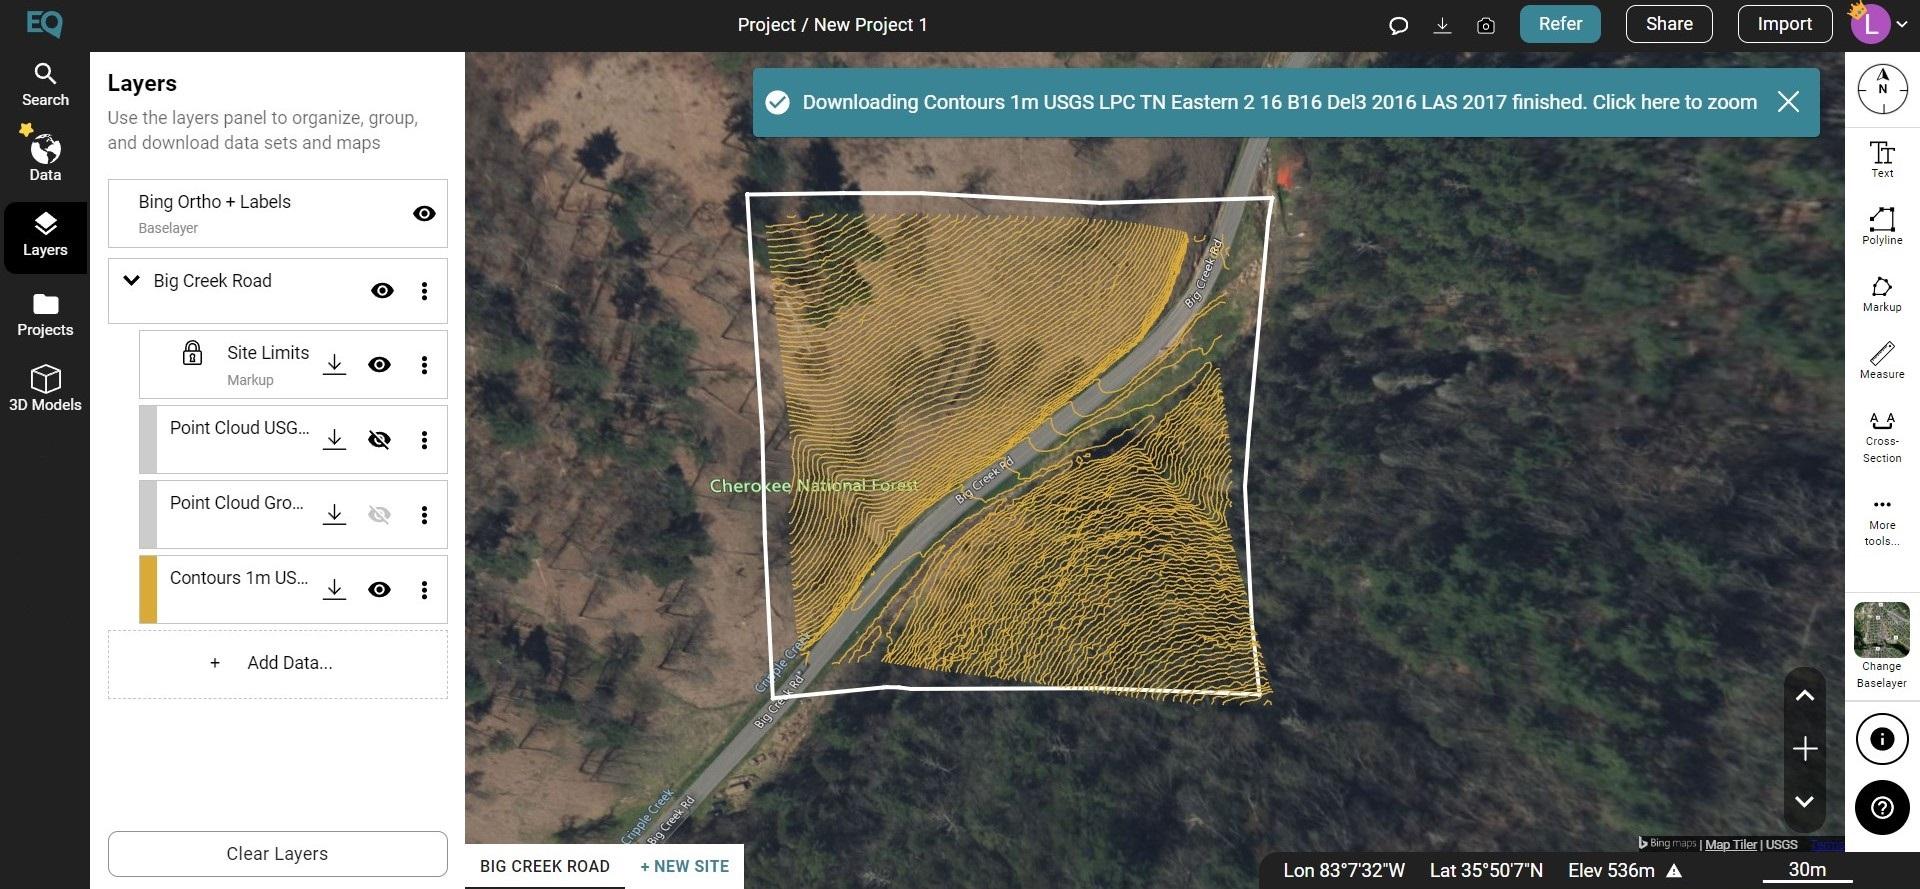
- The contours for your project site will appear within the site boundary.
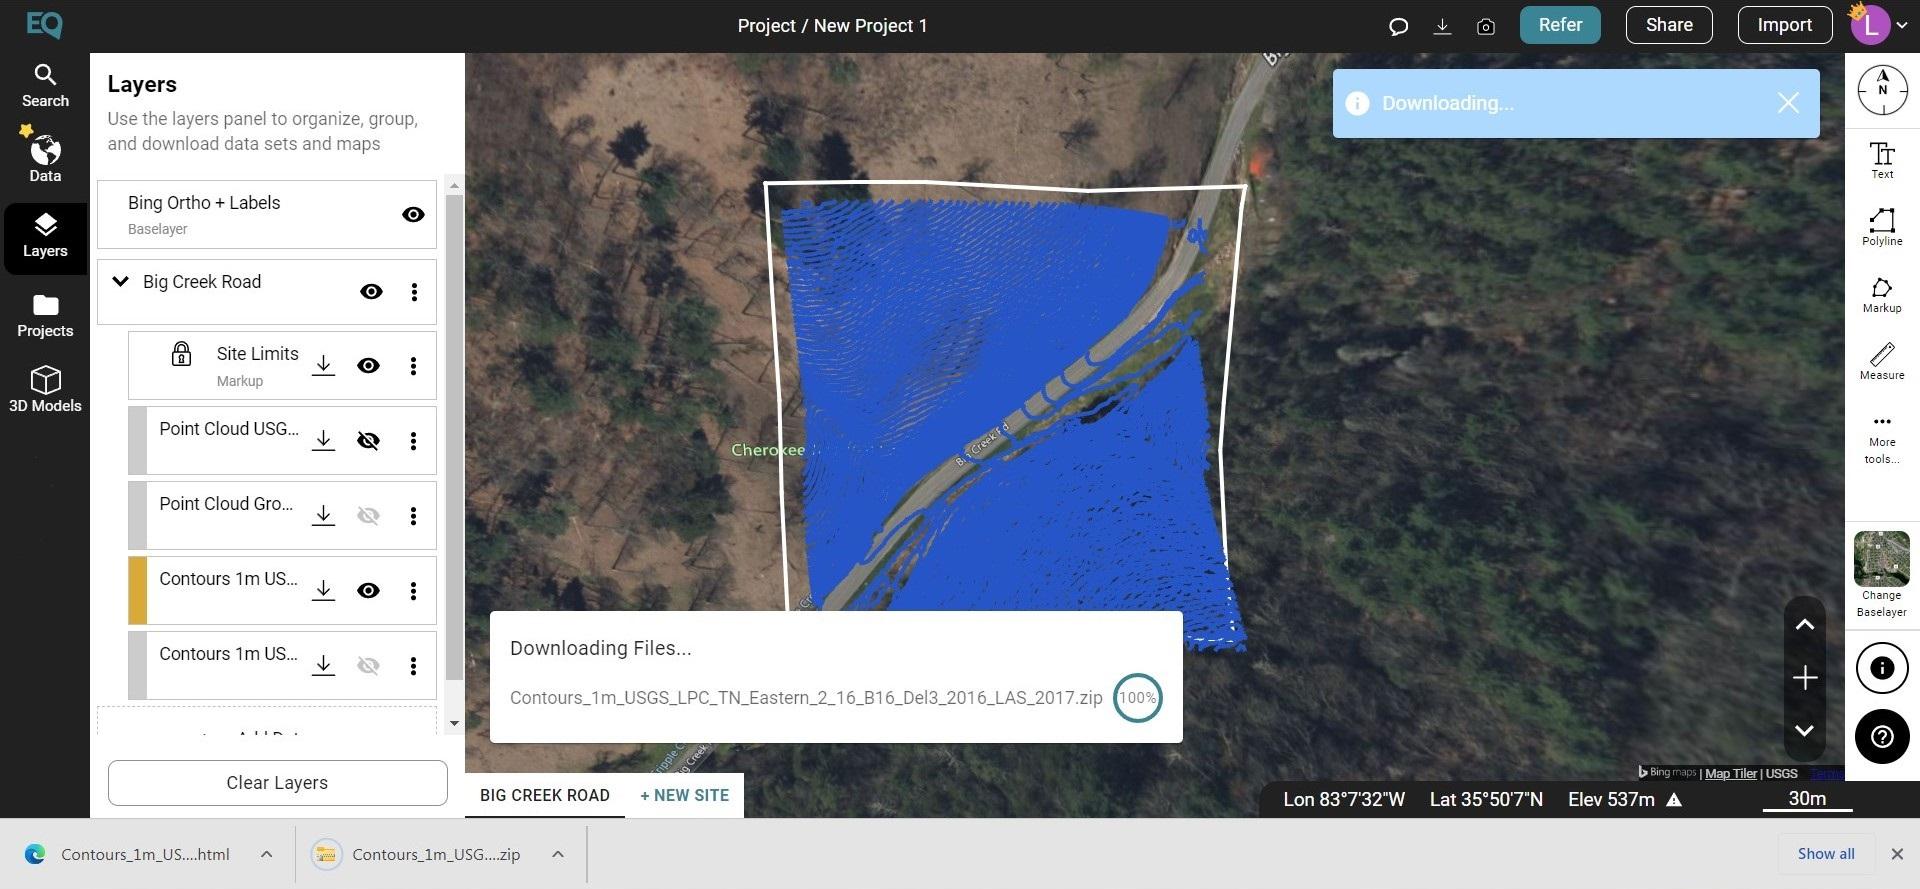
- To export the contours out of Equator as a .dwg file, go to the Layers tab and click the download button beside the contours layer.
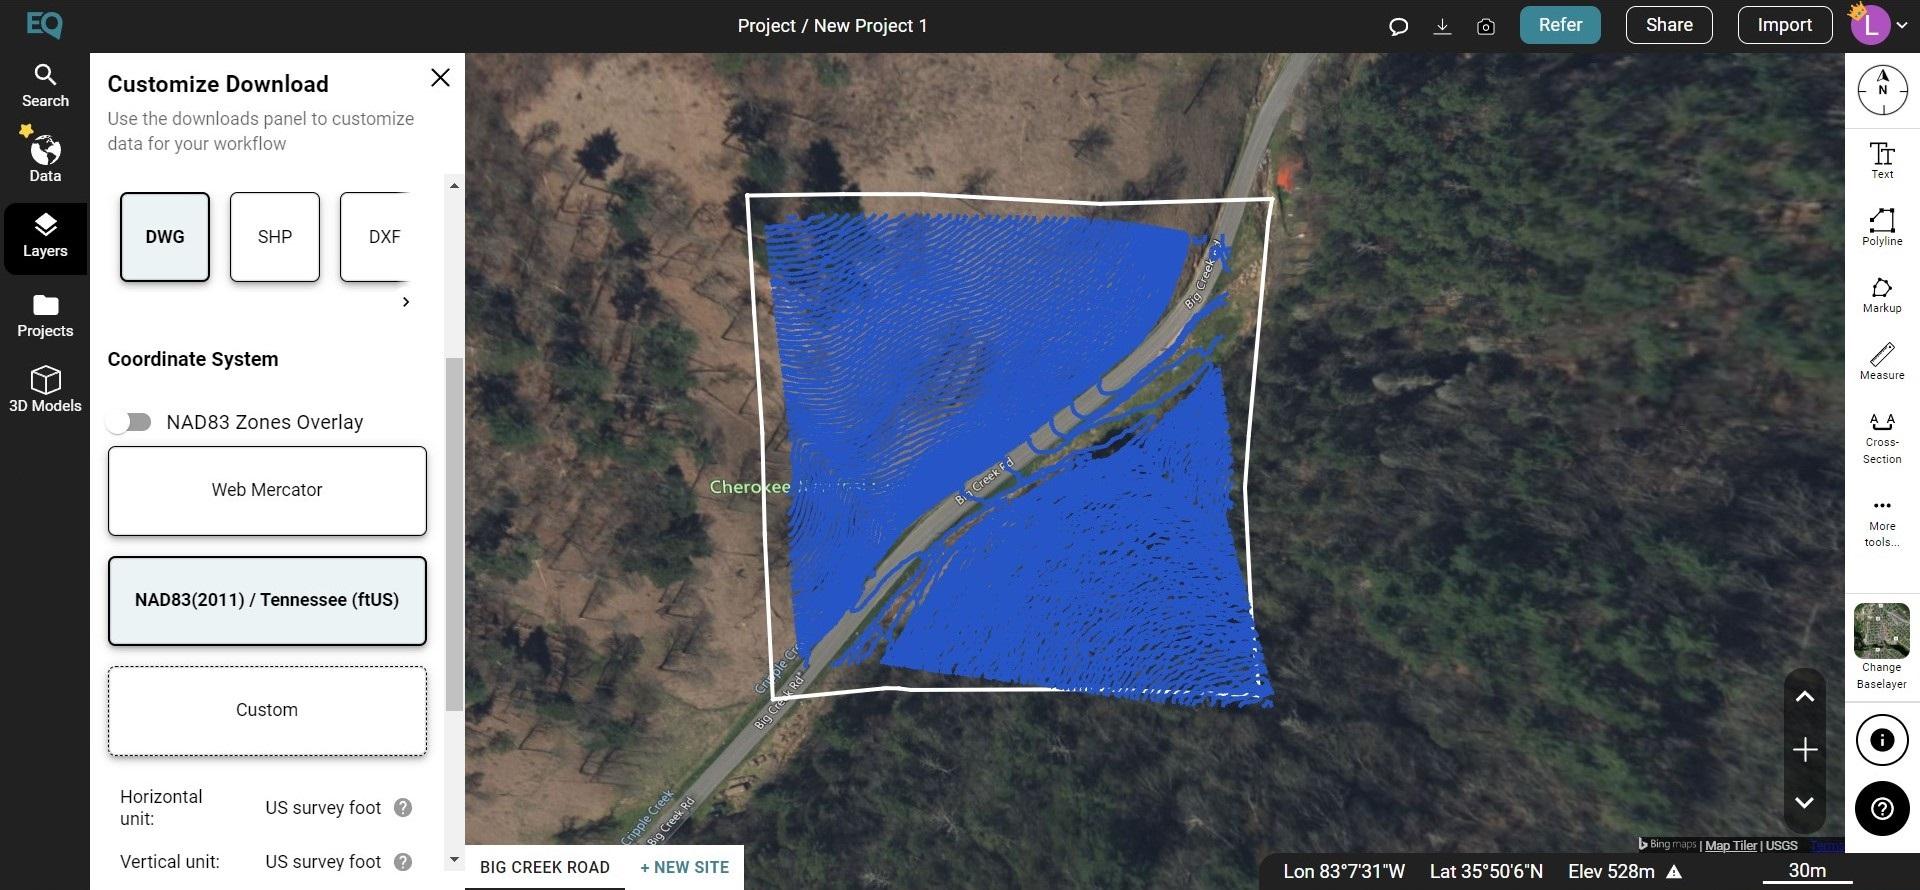
- The Customize Download dialog box will appear. Select DWG as your format, set your coordinate system, and press Process.
- Your contours drawing file (.dwg file) will download into your Downloads file.
Step 2: Import Contour Drawing File (.dwg) into MicroStation and Create 3D Mesh
Note: This tutorial is created using MicroStation 2023 (version 23.00.00.108)
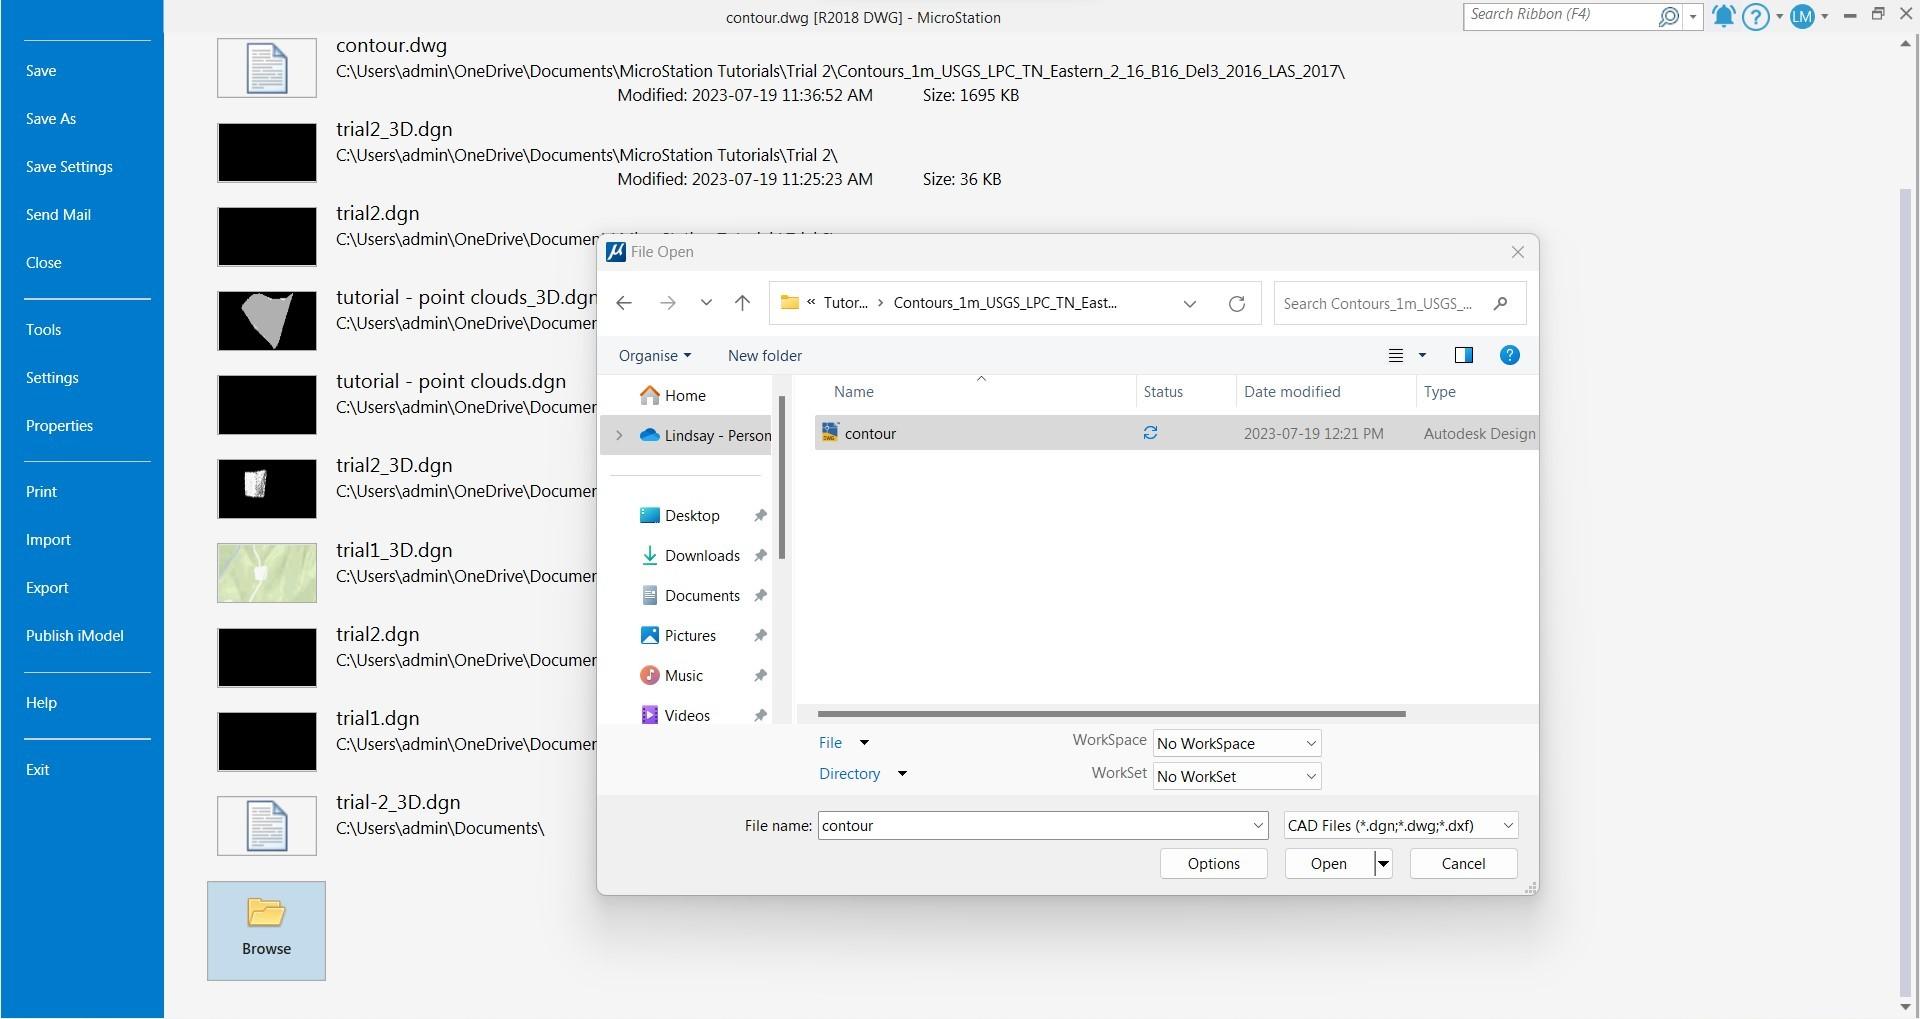
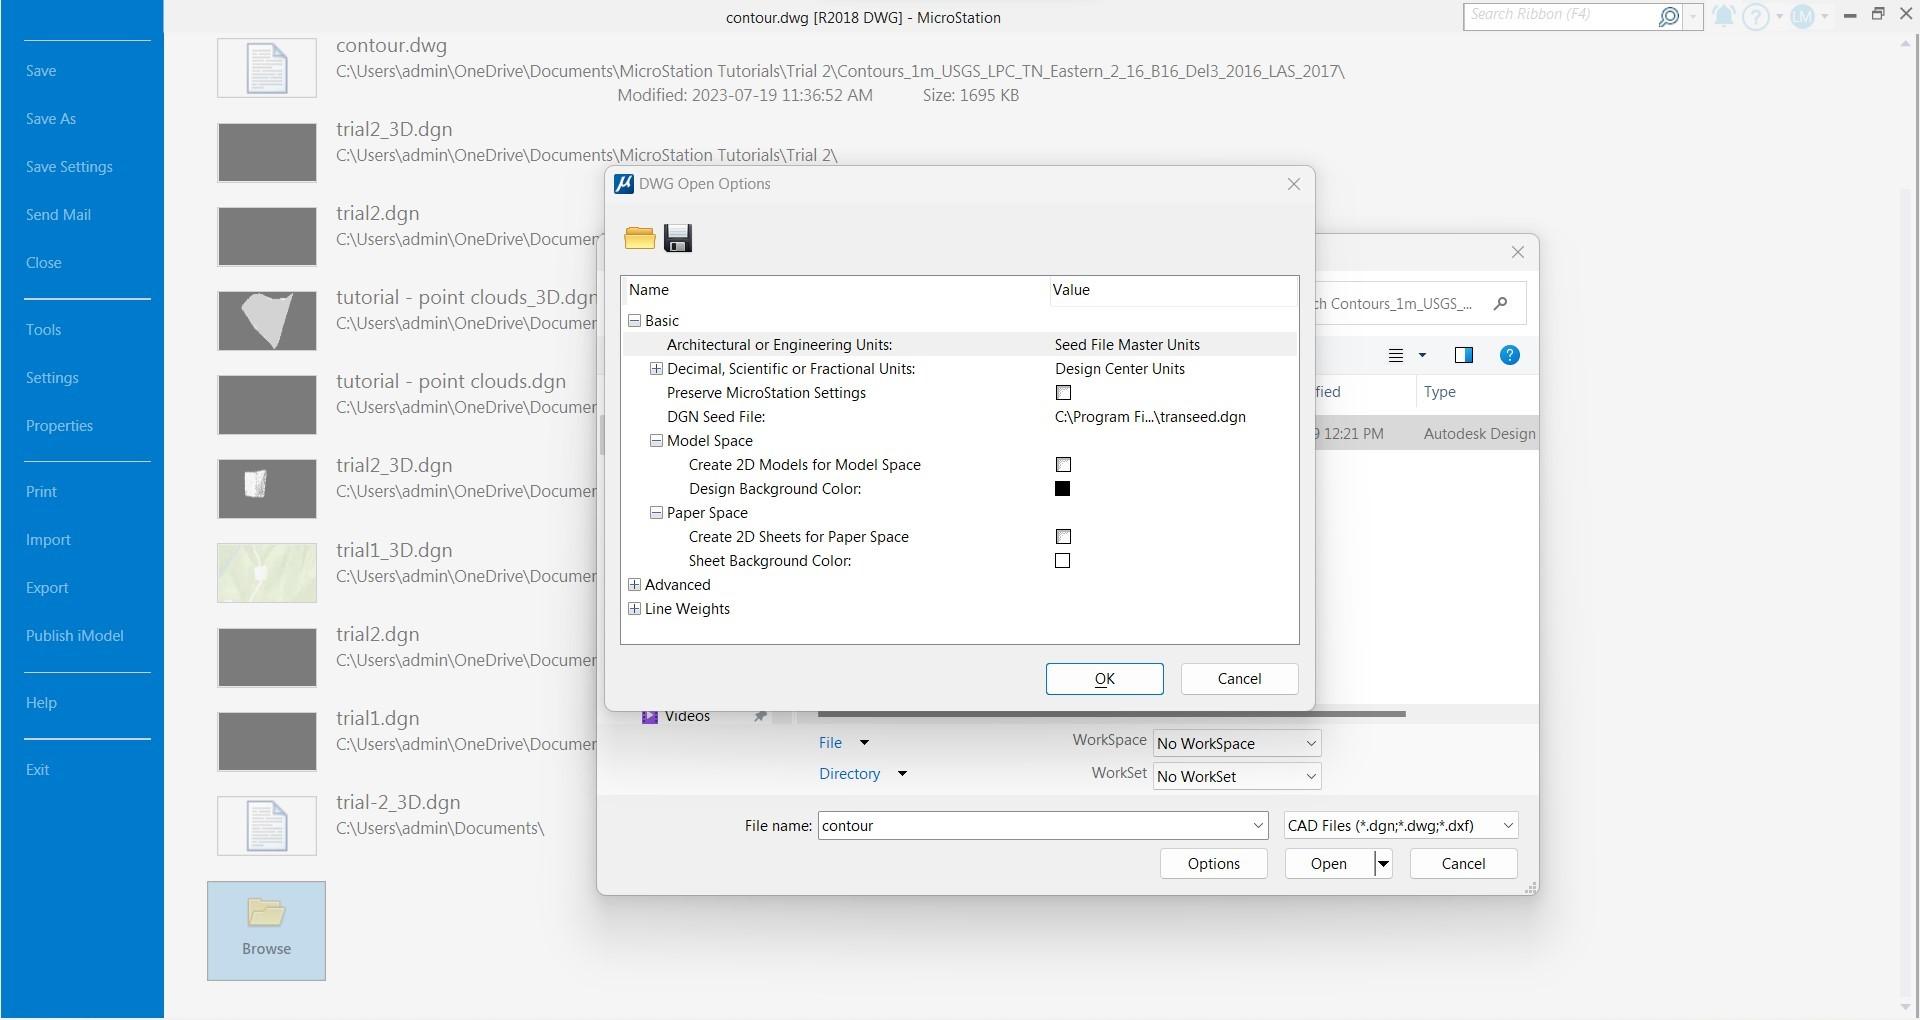
- Open the contours drawing that was downloaded from Equator. Under Options in the open menu, change Basic > Architectural or Engineering Units to Seed File Master Units (or Meters/Ft depending on what you downloaded your contour file in). This will ensure your projection and units matches your drawing.
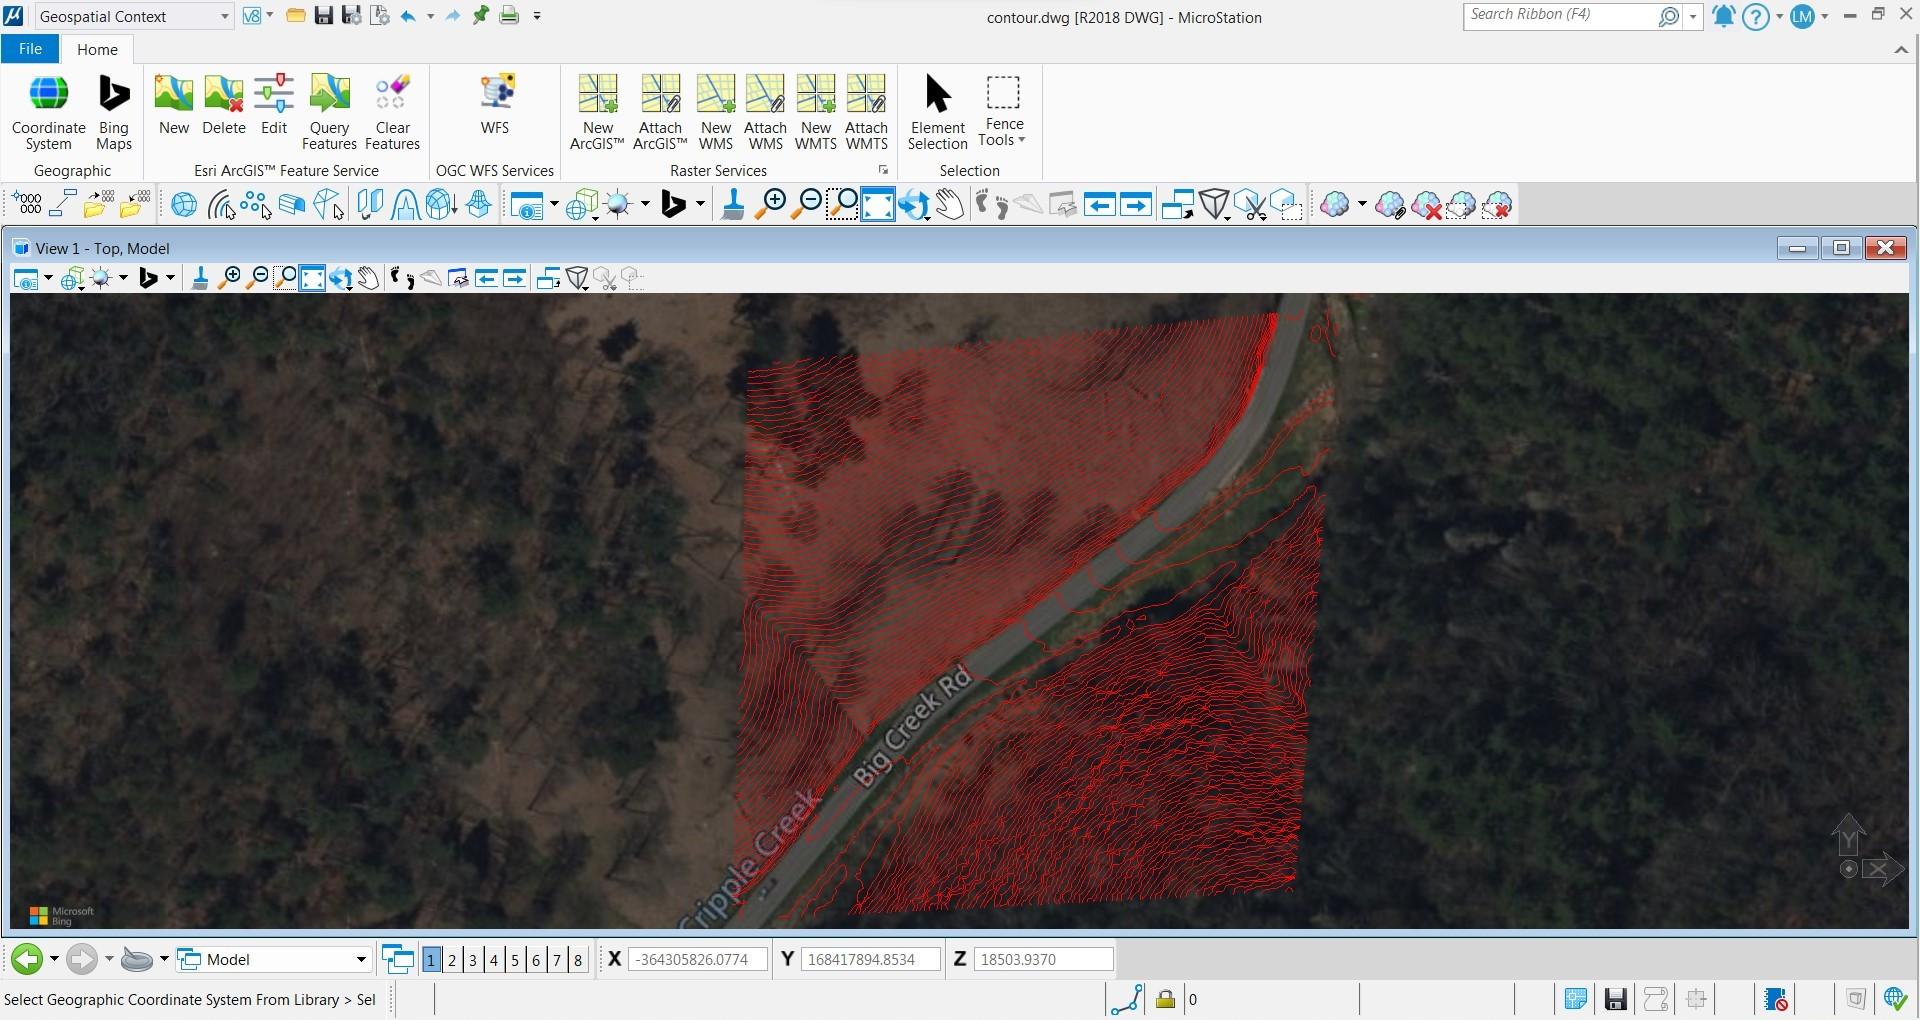
- To make sure your surface is in the correct spot, turn on Bing Maps in the background.
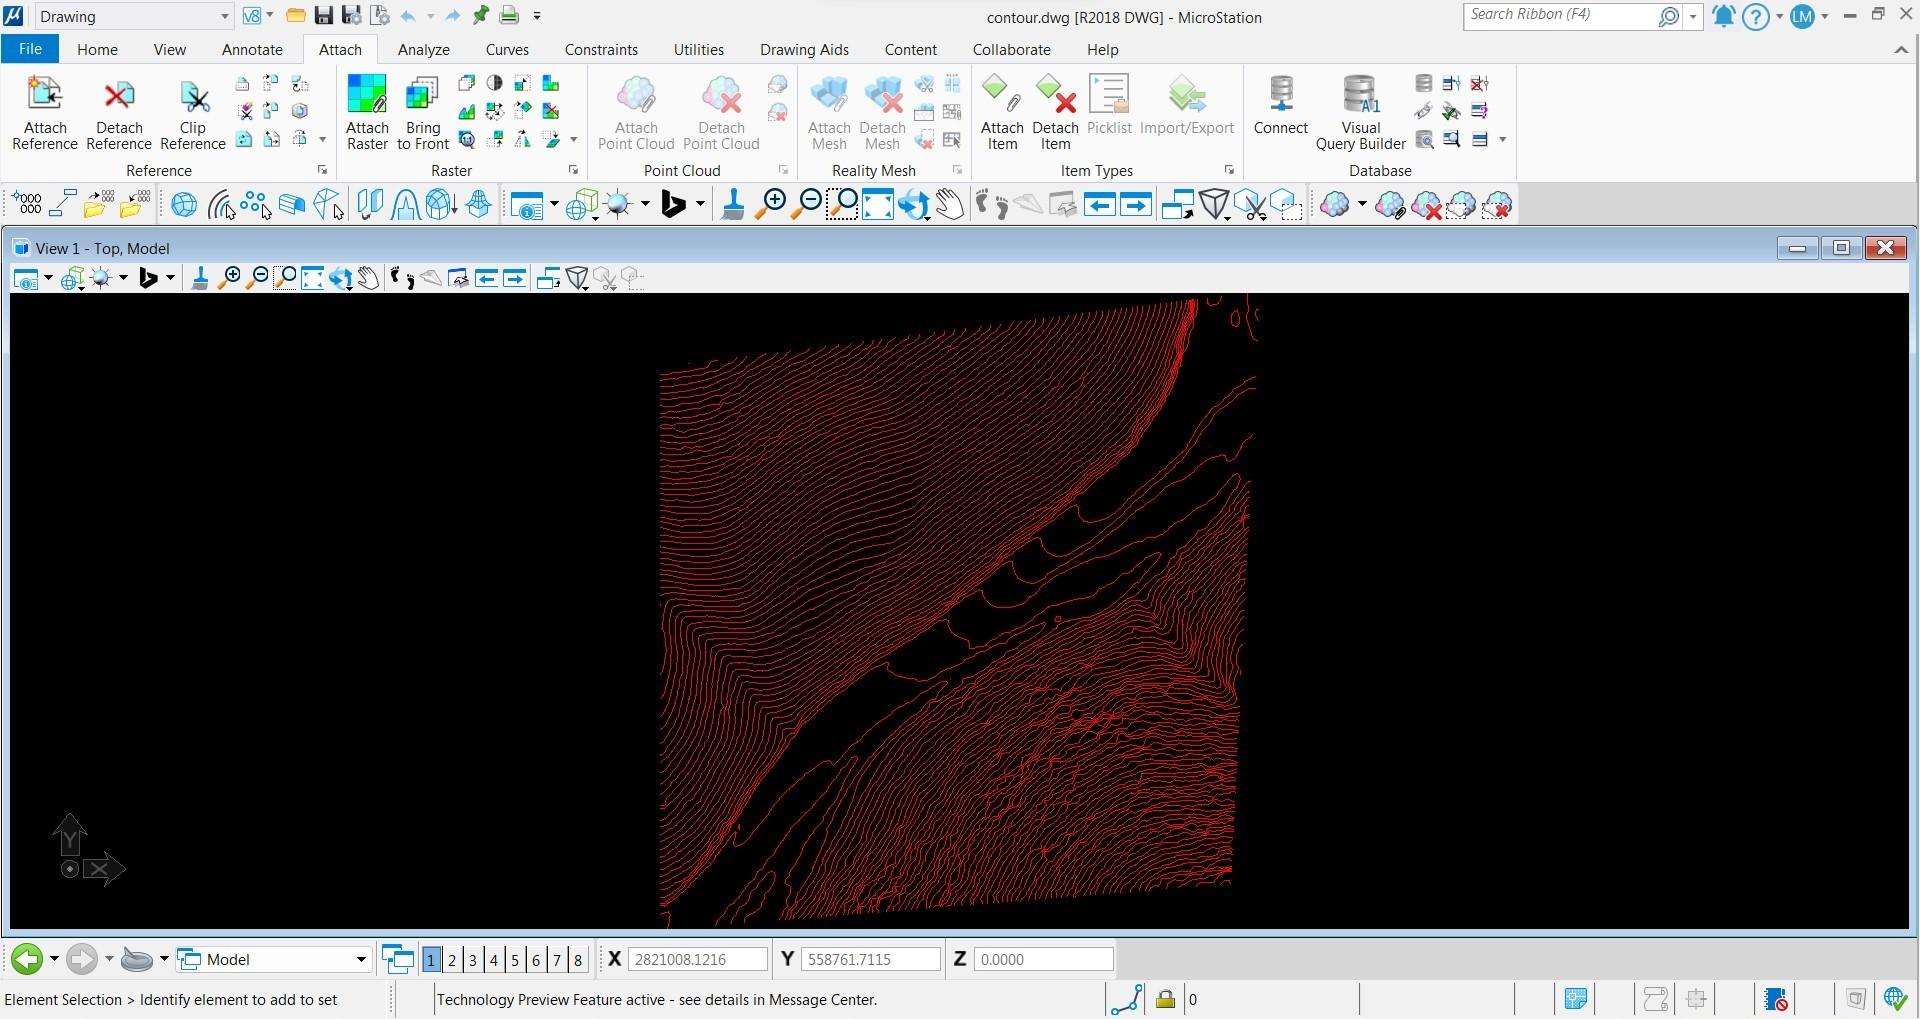
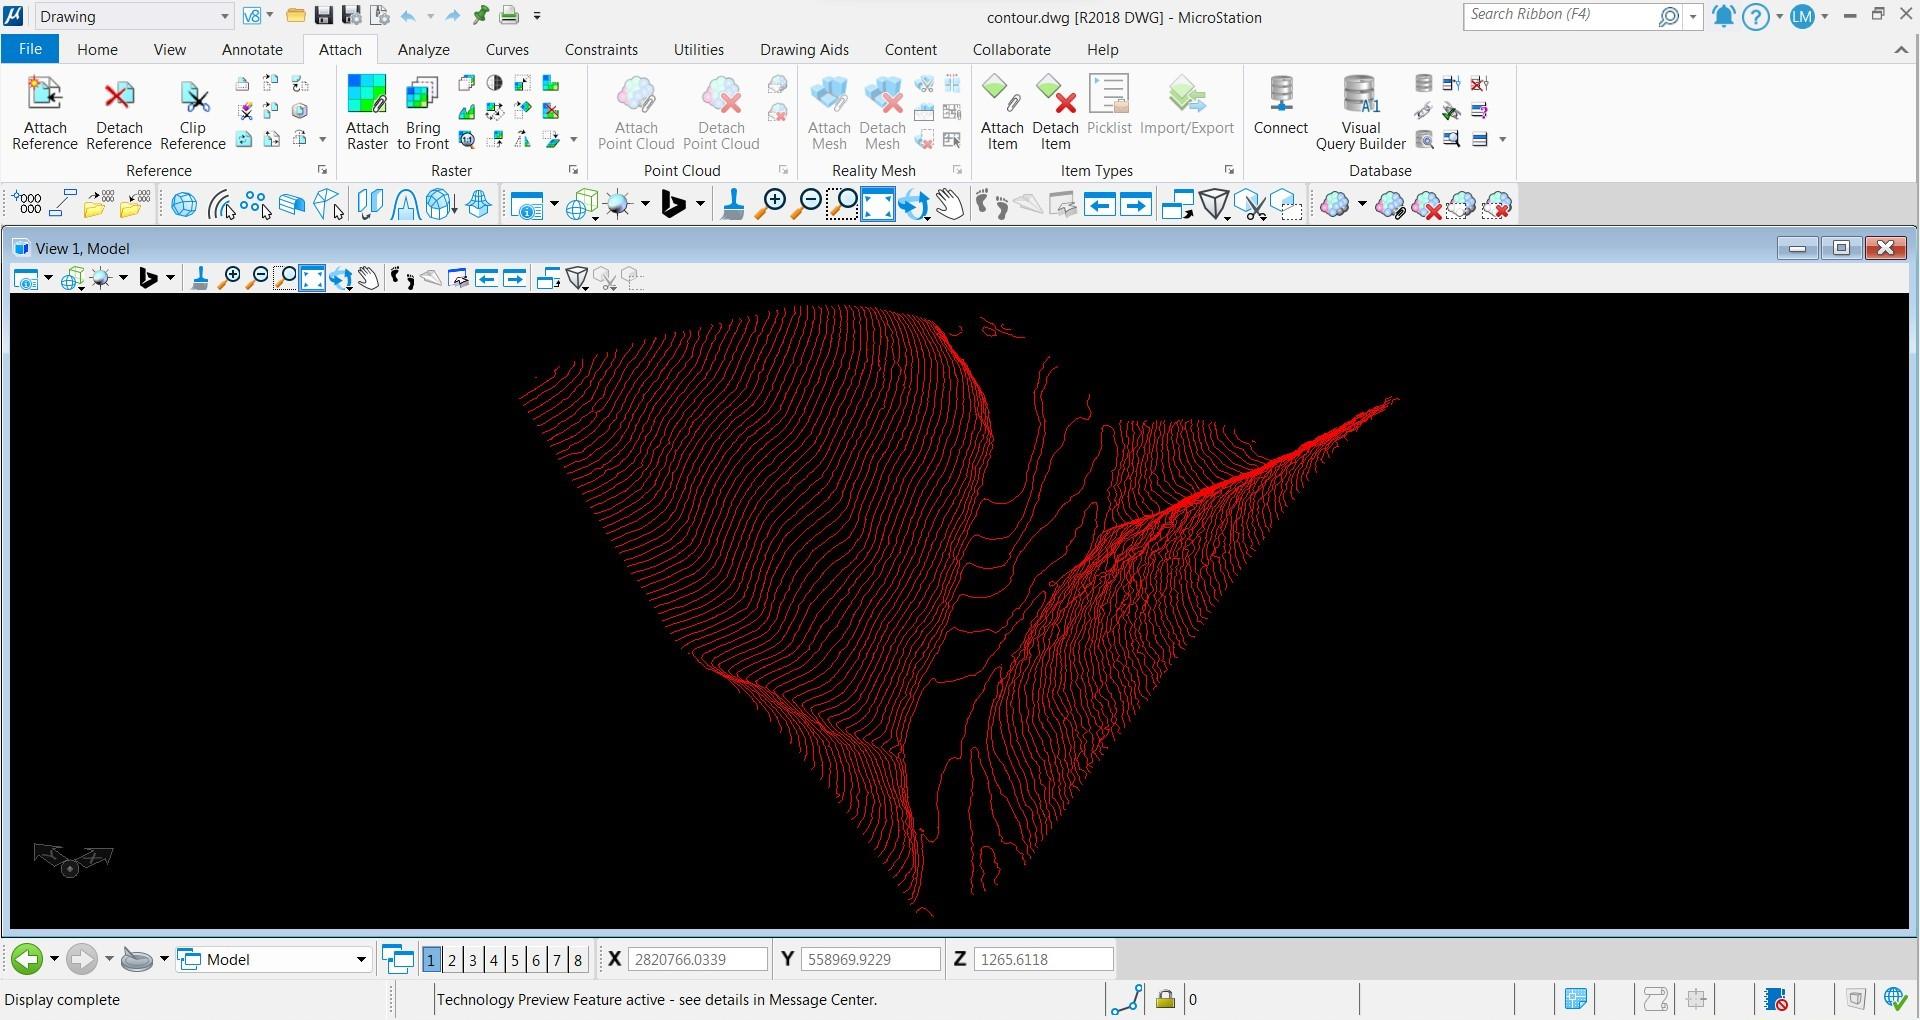
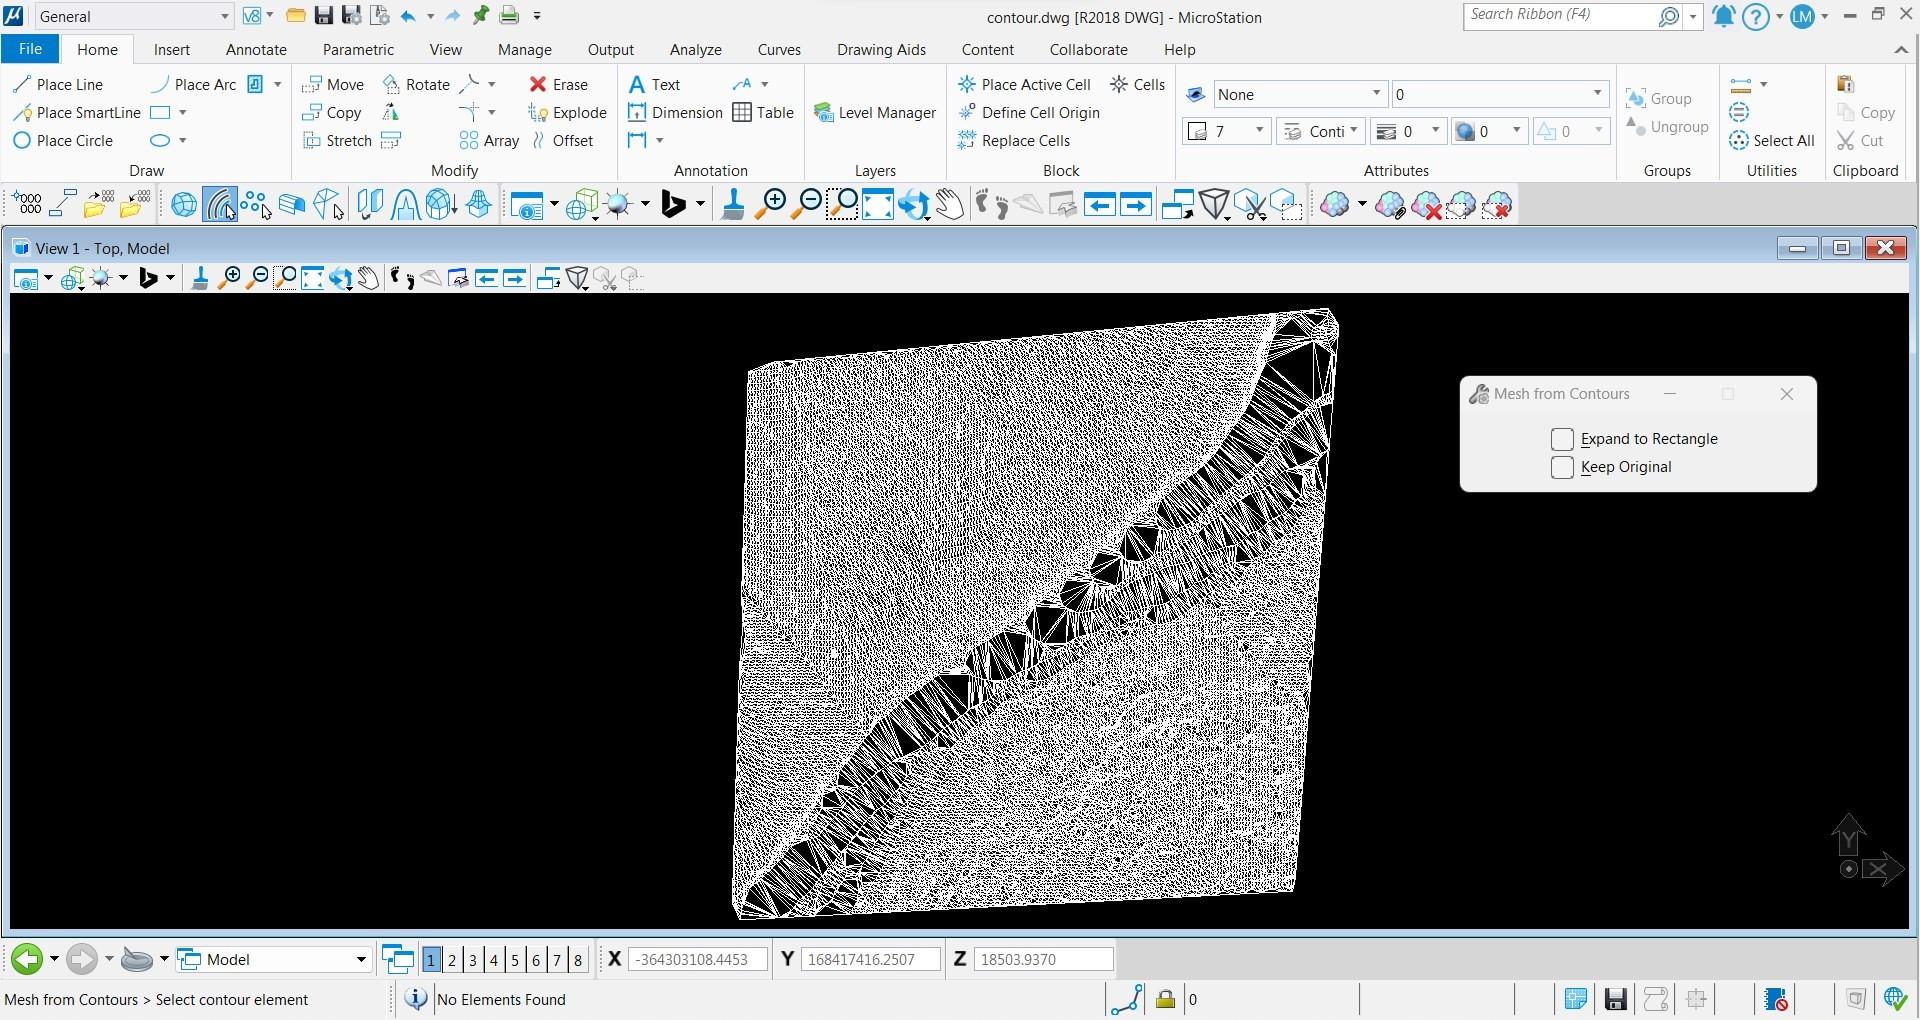
- In the Mesh Surfaces tool box, select Mesh from Contours. Select all your contours.
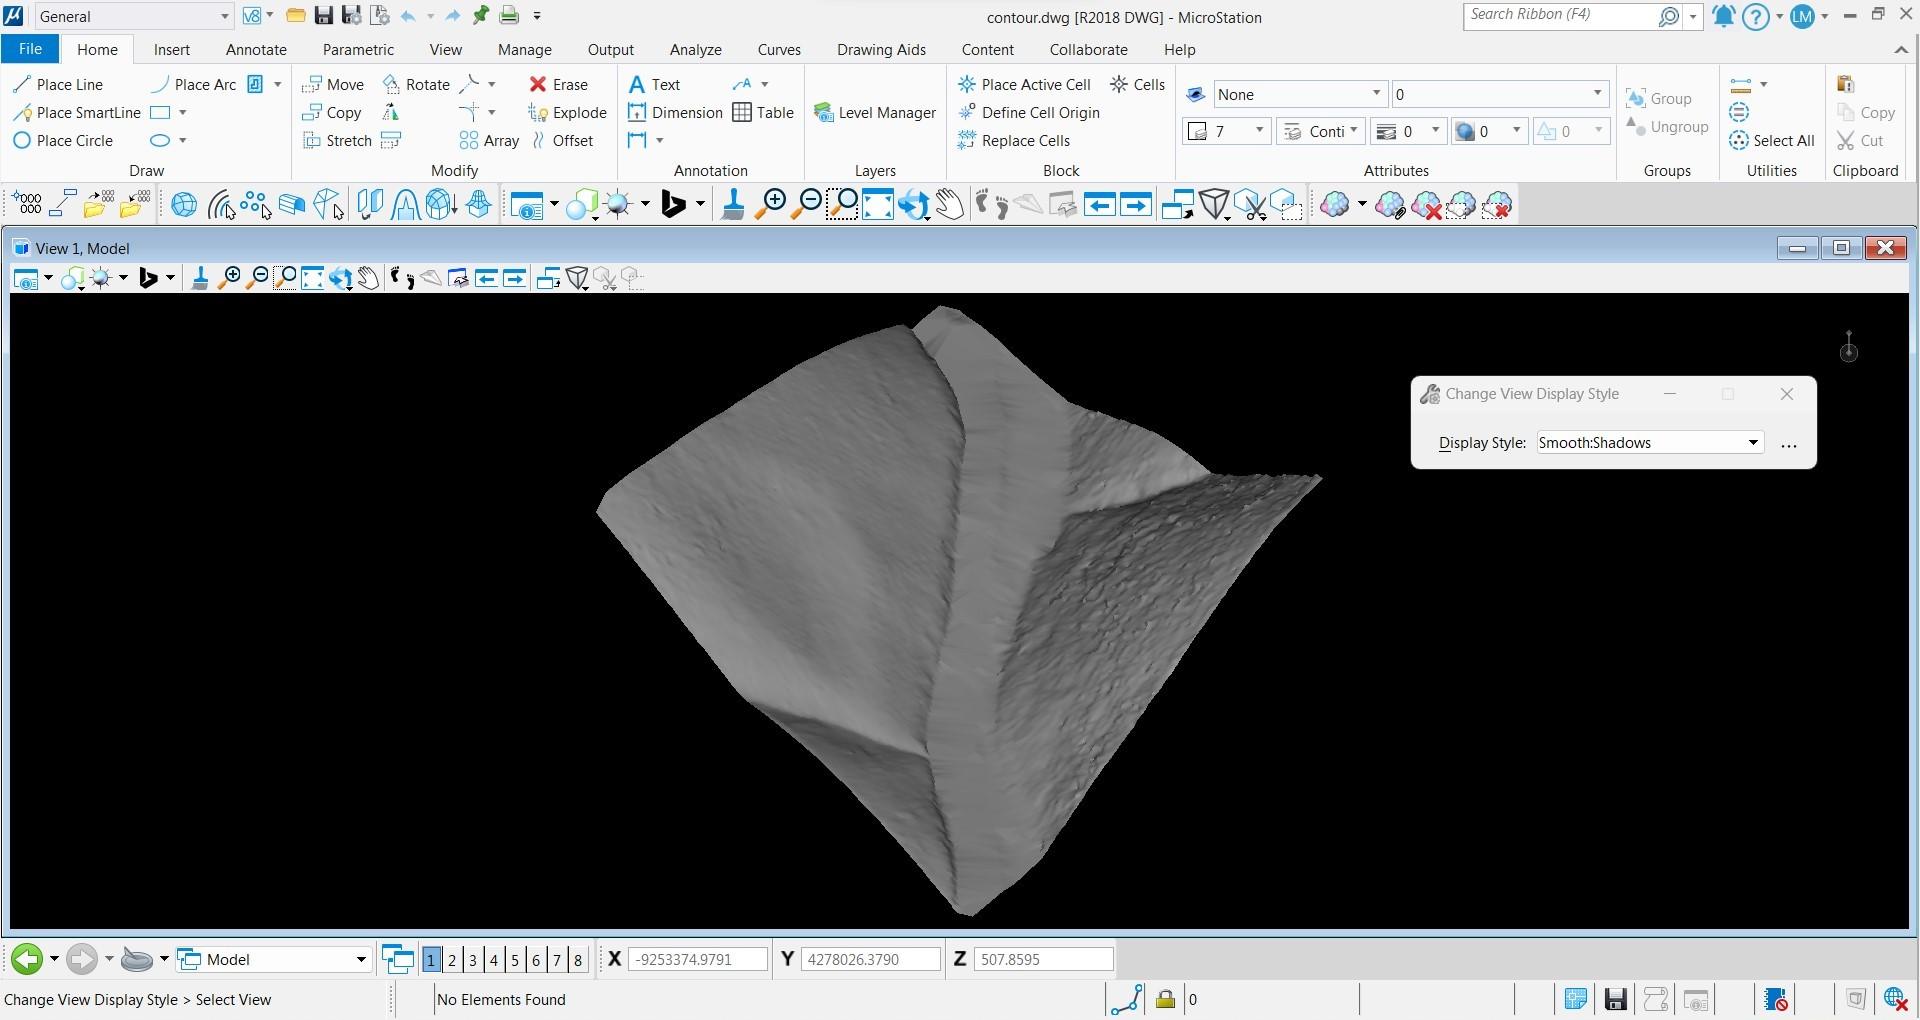
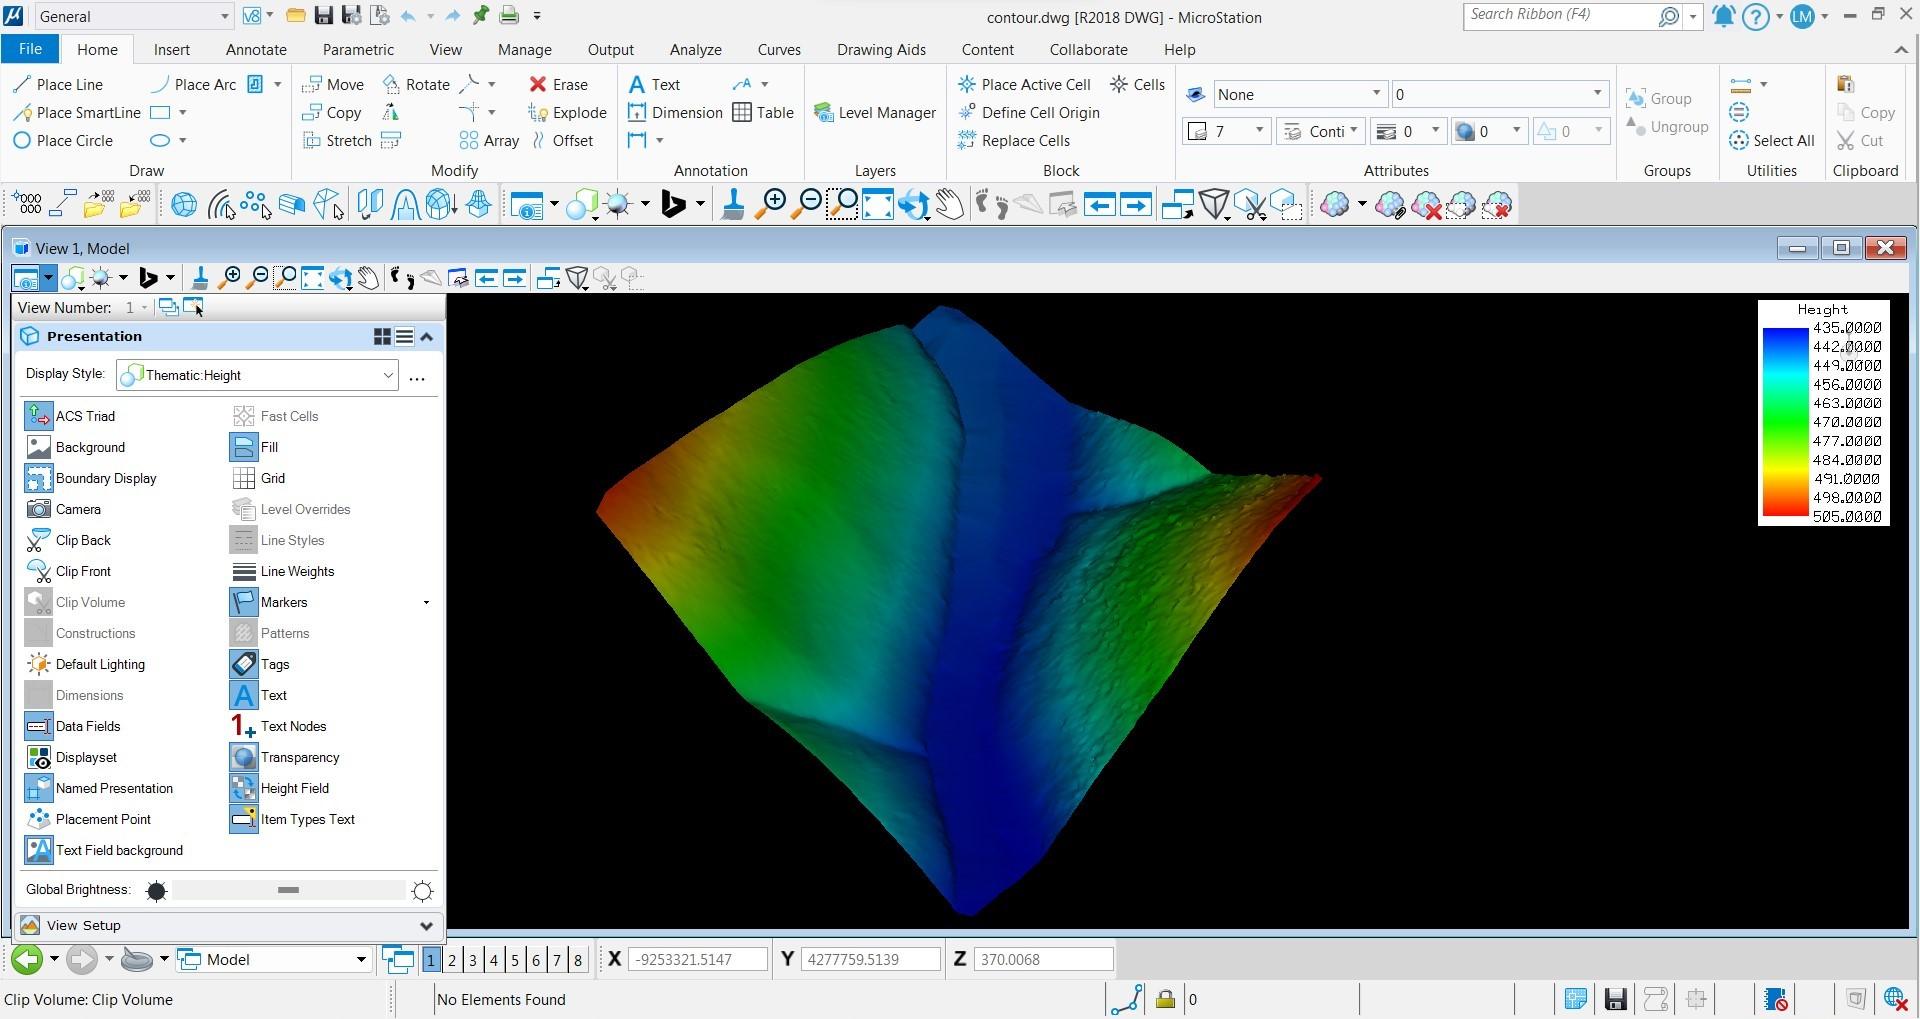
- Your 3D mesh will be created. You can change the visualization of it by changing the Display Style in the Presentation menu.