What is a Digital Elevation Model (DEM)? Where can I Download Data? (and other answers)
What is a Digital Elevation Model (DEM)?
Equator Studios is the largest repository of high quality topographic DEM downloads this side of the globe! Click here to access the map generator and start downloading the highest resolution DEMs on the web.
A Digital Elevation Model (DEM) is a digital cartographic dataset that represents a continuous topographic elevation surface through a series of cells. Each cell represents the elevation (Z) of a feature at its location (X and Y). Digital Elevation Models are a “bare earth” representation because they only contain information about the elevation of geological (ground) features, such as valleys, mountains, and landslides, to name a few. They do not include any elevation data concerning non-ground features, such as vegetation or buildings.
Digital Elevation Models can be used to create topographic maps of overland terrain, as well as bathymetric maps, which serve to illustrate underwater terrain!
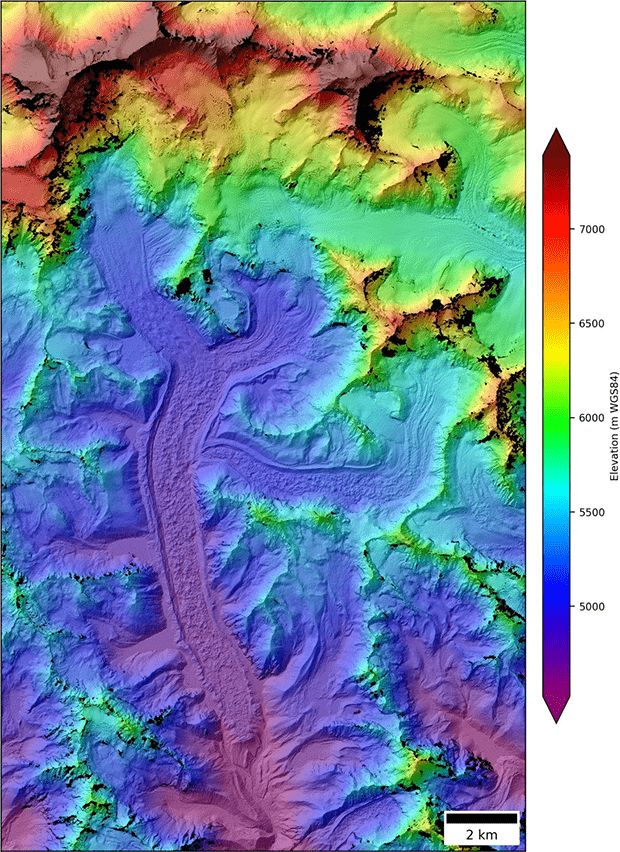
Digital elevation model (DEM) of Mt. Everest region (Source: Wikimedia)
Try Equator for Free
Access high-quality digital elevation models (DEMs) using our 3D mapping software.
Find accurate elevation data in minutes.
Digital Elevation File Formats
Digital Elevation Models come in several different file formats, such as GeoTIFF, IMG, Gridfloat (.flt), and ArcGRID. However, the GeoTIFF file format is most commonly used throughout the geospatial community worldwide because of its interoperability among computer systems and many commercial GIS and spatial data analysis software products.
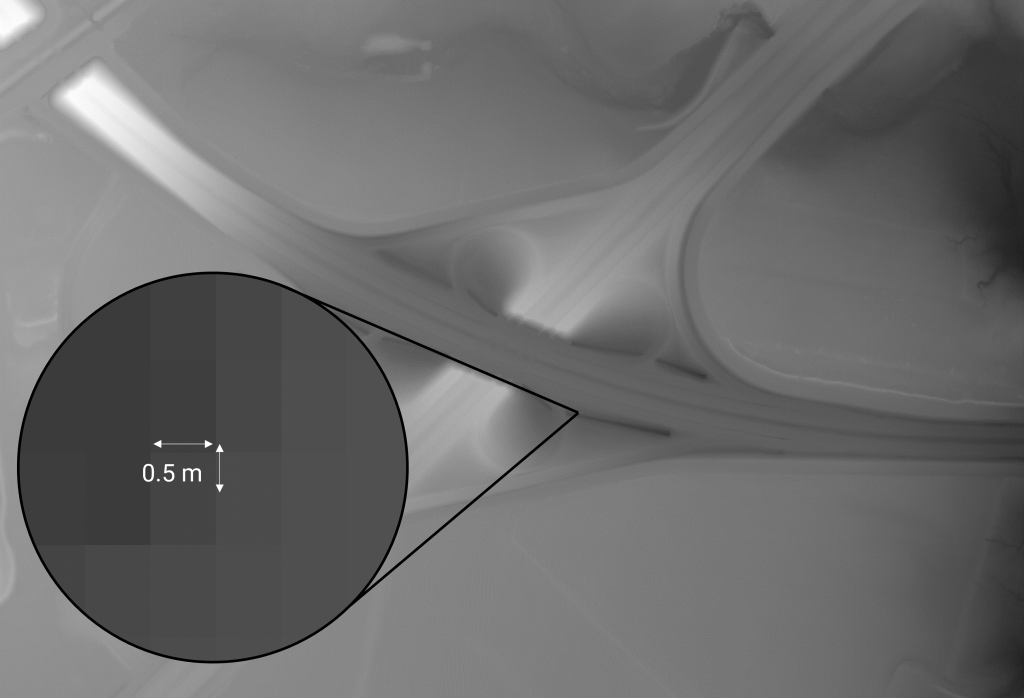
Example of a GeoTIFF (raster) file where elevation values are stored in a regular grid (Source: Equator)
What is a GeoTIFF?
Essentially, GeoTIFFs are raster files containing georeferencing information, like elevations, coordinate systems, ellipsoids, datums, and projections. A defined set of TIFF tags are used to convey information, all of which is embedded within the raster fi
In the 1990’s, the GeoTIFF format was developed by adding geographic metadata to the TIFF format as TIFFs are considered lossless and extensible. GeoTIFFs became a standardized format under the Open Geospatial Consortium (OGC), who have specified requirements and encoding rules for using TIFFs to share georeferenced or geocoded imagery. The specifications can be found here.
What is a Cloud Optimized GeoTIFF
Recently, a new imagery format designed for cloud-native geoprocessing in mind is being developed, called Cloud Optimized GeoTIFF (COG). COGs were created to solve the issue of large file sizes of raw data and the constant duplication of data when it’s being shared. Historically, data was duplicated many times because there was not an efficient method of storing or distributing geospatial data. The COG aims to solve this problem.
Essentially, COGs are GeoTIFFs hosted on an HTTP file server that leverages a better structure for processing (tiling, compressing) and storing the data. When you access COGs online, the system allows you to only access the section of the data that you’re interested in rather than downloading the whole file. Overall, this allows for fast streaming at full resolution and progressive rendering.
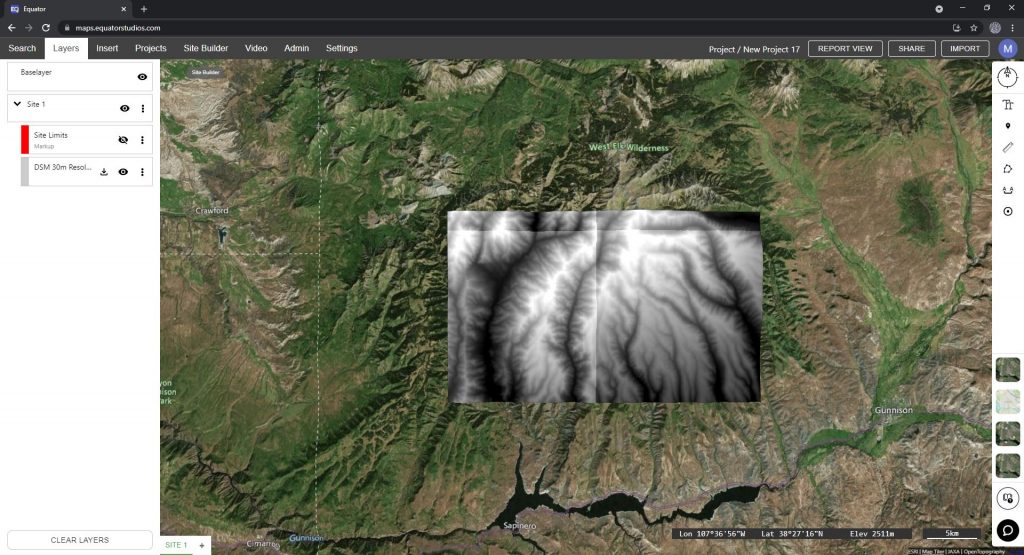
Example of a Cloud Optimized GeoTIFF in the Equator platform
Essentially, COGs improve product processing time and storage, and support new cloud processing capabilities. In addition, legacy software can still read the file with no modifications because their underlying file format is a GeoTIFF, but there are several new software libraries and tools coming online that are aimed to support COGs. To learn more about this process, you can check out this lecture.
What is a raster file?
Raster data are cells (pixels) organized in a grid of regularly sized cells and represent some type of real-world phenomena. Although raster datasets are used in a GIS, you might already have experience with rasters if you have ever used a camera, since they are just digital pictures. When a raster is used to store elevation data, the size of the cell is typically determined by the spatial resolution of the satellite or LiDAR sensors used to collect the data.
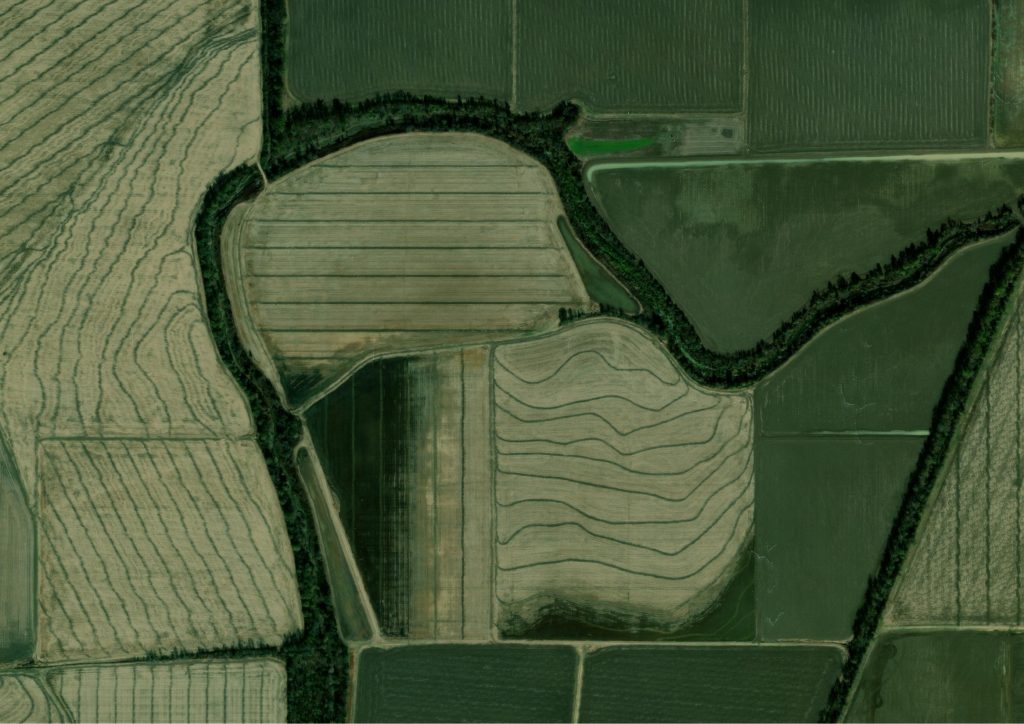

Satellite image raster (left) vs Digital Elevation Model raster (right) near Tunica, TN (Sources: ESRI, USGS, Equator)
Rasters can be classified into three different data types: discrete (thematic) data, continuous data, or pictures. Discrete (thematic) data is used to create thematic maps. These maps display phenomena which can be broken down into specific categories where each cell in the grid represents a distinct feature with clear boundaries. Discrete rasters usually use integers to represent different classifications of the dataset. For example, if we’re creating a thematic map to show the land cover of a particular area, then we would create a land classification where a cell with a value of 1 might represent agricultural land and a cell with a value of 2 might represent urban areas. Cells will then be coded by colour according to their values and two distinctive features will be visible.
Continuous rasters display phenomena which do not have abrupt or well-defined breaks between cell values but gradually vary in intensity from a specific source. For example, DEMs use mean sea level as a fixed point and each cell within the DEM represents a value either above or below sea level; the elevation value continuously changes across a landscape.
Pictures, like scanned maps or drawings, are also considered as raster data and can be used as basemaps over which other feature layers (like road networks) can be displayed.
Raster files can potentially require a significant amount of storage space depending on the spatial resolution of the file. Spatial resolution, particularly for raster data collected through remote sensing or LiDAR, is typically determined by the sensor capabilities used to collect the data. In short, a higher resolution dataset, for example a DEM with a 1 meter spatial resolution, will require more storage space compared to a DEM with a spatial resolution of 20 meters. This is because a raster file with a 1 meter spatial resolution contains more pixels of smaller size compared to a raster file with a 20 meter spatial resolution; the more pixels (cells) there are within an image, the higher the resolution and feature spatial accuracy, and ultimately, the larger the file size. Depending on the extent and detail required to complete your project, it might be better and easier to use a raster file with a lower spatial resolution, especially if the area you’re studying is broad and does not require a highly detailed dataset to complete your analysis.


10m resolution DEM raster (left) vs 1m resolution DEM raster (right) in Jack and Laura Dangermond Preserve, California (Source: Equator, USGS 3DEP LiDAR)
How are DEMs created?
There are several methods that can be used to generate digital elevation models:
Ground surveying can be used to create Digital Elevation Models, however, this method is extremely time consuming and laborious.
Stereogrammetry techniques, such as aerial photogrammetry, are also used to create DEMs. Aerial photogrammetry captures images of the ground using aircrafts or drones with cameras on board and requires the study area to be photographed at several different angles. Slight visual differences appear where these images overlap, which gives these images a sense of depth, and it’s through this stereo overlap that we can extract 3D information from photographs. It’s also possible to generate a Digital Elevation Model through Visual and Infrared (VIR) imagery. However, visible and infrared light waves are not capable of penetrating weather clouds and are not effective at night.
Radar interferometry is also used to measure elevation data and is capable of mapping the ground in bad weather and at night, unlike VIR imagery. This is because radar signals are capable of penetrating clouds and it’s an active system. This means that it illuminates the surface of the Earth with electromagnetic signals of a specific microwave length and then measures the reflected light. So, active systems can collect images of the Earth even when the sun isn’t present! Interferometry gathers elevation data through successive passes of the Earth either through spaceborne or airborne Synthetic Aperture Radar (SAR). In order to collect this data, a pulse of radar energy is emitted towards the surface of the Earth and then reflected back towards the sensor onboard a satellite or airplane. Two types of information are recorded after the waves are bounced back – amplitude and phase. For the purposes of generating elevation data, phase is the most important data. Phase records the distance from the satellite to the ground and back again, in units of radar wavelength. By comparing the phase value for each pixel in two radar images, and after computation and a series of geometric corrections are made, altitude values are determined and high quality digital elevation models can be generated. This method of collecting data can be accurate to within centimeters; an example of a spaceborne craft that used this technique is the Shuttle Radar Topography Mission (SRTM) which launched in 2000.
A multibeam echo sounder is used to collect bathymetric data. The echo sounder transmits pulses of sound into the water and the sound waves that are echoed back towards the echo sounder are recorded. The time it takes between the emission of the sound pulse and its return is used to reach an estimation of the depth of the water. This can either be accurate down to several centimeters or several meters depending on the sounder itself and the distance between the sounder and the geological feature. This device is typically mounted beneath or over the side of a research vessel but this data can also be collected using remotely operated vehicles (ROVs) or autonomous underwater vehicles (AUVs). Check out Sea-Kit as an example of an autonomous research vessel! However, it’s also possible to use satellite remote-sensing techniques as well as LiDAR to collect this data.
Light Detection and Ranging (LiDAR or Laser Altimetry) is the final method on our list that can generate a Digital Elevation Model. A laser altimeter is typically installed on a plane or drone (but also on satellites; check out NASA’s ATLAS on the ICESat-2) and works by emitting a series of short laser lights in a sweeping motion, side-to-side. These lights travel to the surface of the Earth and are then reflected back to the laser altimeter. When the light is detected by the laser altimeter, a time counter, which began when the laser lights were first emitted, stops. In order to generate a laser (LAS) dataset, a simple series of mathematical equations are completed to determine the distance the light traveled to the ground. Check out this video to learn more about how this is calculated! The LAS dataset that’s generated then needs to be interpolated in order to produce a continuous raster dataset for elevation – then voilà! You’ve got yourself a DEM. You might also find that lidar data comes in a LAZ file format but this is just the compressed file version of an LAS dataset. The accuracy of this method can also be within centimeters of the location of real-world features.
Importance of DEMs and its Uses
Digital Elevation Models are a core spatial dataset required for many environmental, planning, and scientific applications. A few examples are highlighted below.
- Environmental planning
- Military applications
- Emergency responses
- Hydrological functions: including drainage basin network assessments, understand drainage patterns, flood modelling and risk analysis
- Slope and aspect models: created for thematic classification datasets and to generate hazard maps.
- Transportation planning
- Geological survey and analyses
- Landscape archaeology: for example, using DEMs to search for microreliefs in the landscape, or monitoring changes in glacier ice-volume can also be determined by comparing DEM datasets generated at different times.
- Topographic maps are also produced with DEMs.
- Maritime transportation: Bathymetric data can be used to create nautical charts, monitor changes in coastline features, create conservation maps, and create important scientific models.
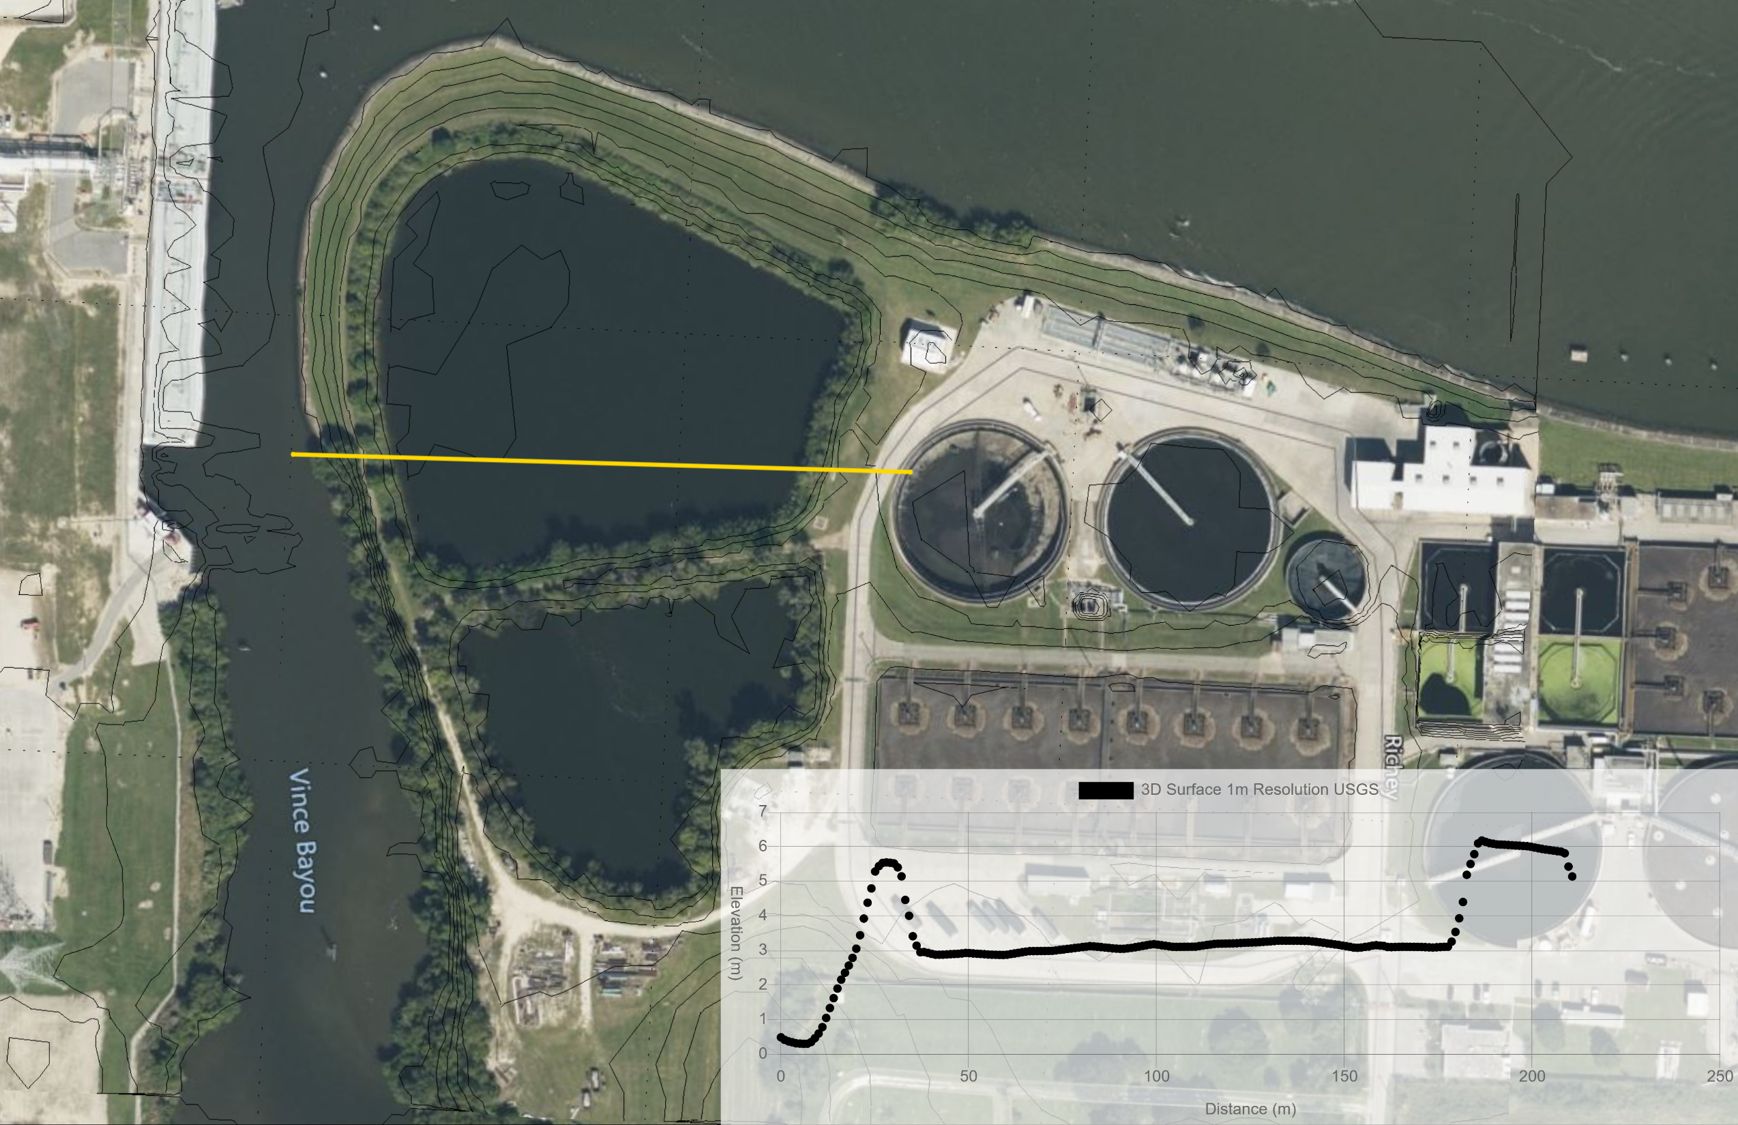
Example of a digital elevation model used for flood planning. The image shows a cross-section through a water control facility near Vince Bayou, TX (Source: Equator, USGS, ESRI)
Case Studies / Highlighted Applications of Data
Exploration of Mars
As it turns out, we can use the same tools that we just learned about to map Mars. So, how about we suit up and head on over and see what’s happening?
n 1996, NASA launched the Mars Global Surveyor, a spaceborne craft. One of the many sensors onboard was the Mars Orbiter Laser Altimeter (MOLA), which provided three-dimensional topographic data of the surface of Mars but had a spatial resolution of hundreds of meters.
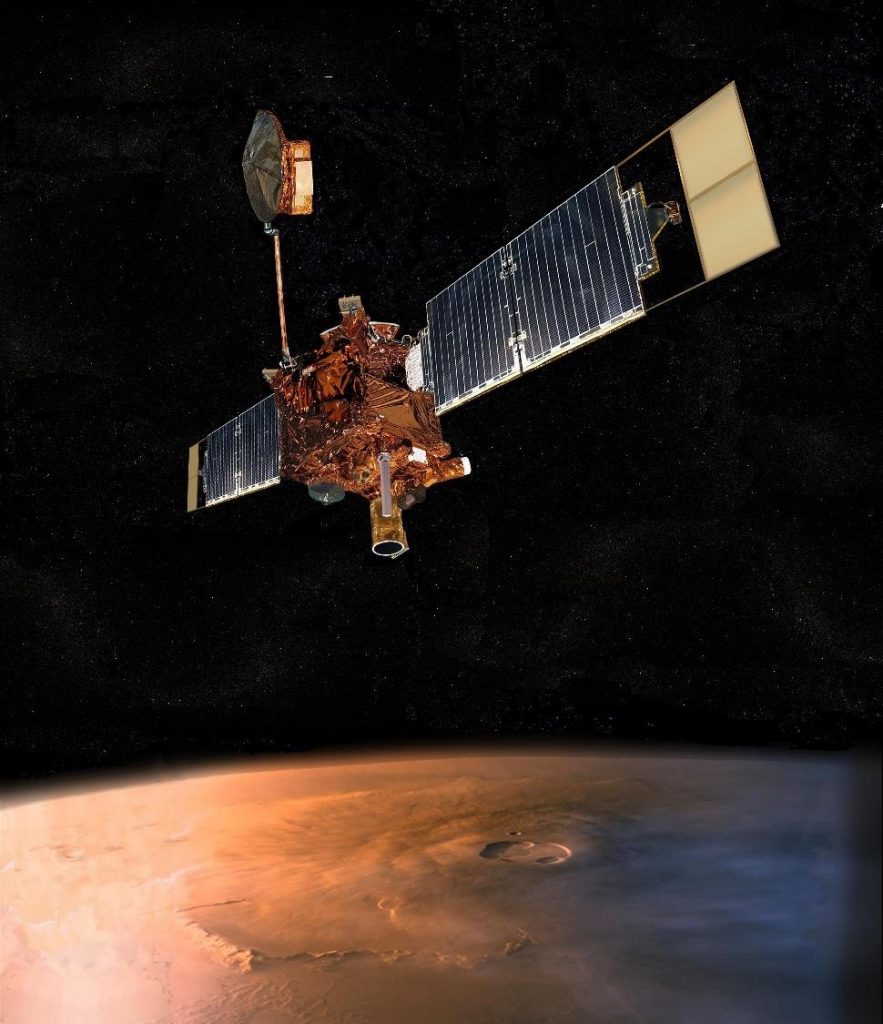
Mars Global Surveyor (Source: NASA, Wikimedia)
In 2005, NASA launched the Mars Reconnaissance Orbiter with the High Resolution Imaging Science Experiment (HiRISE) onboard, which can capture images at around 25 centimeters per pixel. Scientists then overlap images of Mars taken from different angles, and through stereogrammetry, can generate digital elevation models of particular regions of interest. These stereo images can then be used to create hazard maps of the area. This process is crucial in determining potential landing sites, especially for the Perseverance rover, which landed on Mars in February 2021.
NASA’s Perseverance rover was able to use the hazard map in combination with its onboard sensors to scan the terrain during its descent in order to safely navigate and land in one of the safe landing zones that was designated on the hazard map. This allowed the team at NASA to land the rover in more geologically interesting, but more dangerous areas, than was previously possible. Furthermore, the Perseverance rover is also equipped with an enhanced auto-navigation system, called AutoNav, which has the ability to generate 3D maps of the terrain up to 30 meters away, identify hazards, and adjust its routes accordingly. This is done by taking pictures with stereo cameras which allows the rover to sense depth. As a direct result, the rover is able to travel more direct routes and reach sites of interest much more quickly than was previously possible!
Although space is fascinating, there are plenty of interesting projects involving the use of DEMs right here on Earth. Let’s splash back down and see what’s happening in our ocean before stepping back on dryland!
Sur Ridge Marine Exploration in California
We might initially think that the seafloor is flat and not as remotely captivating as the geological structures we find on land. However, just like on land, the seafloor is a complex and variable terrain but only around 20% of it has been mapped, let alone explored. For example, about 60 kilometers off the coast of Monterey Bay, California lies a large underwater geologic feature called Sur Ridge. It’s abundance of sea life had not been realized until 2013 when an ROV was first sent to explore the area.
Between 2015 and 2020, the Monterey Bay’s Aquarium Research Institute (MBARI) has been carrying out survey expeditions to map out the region. They first began by using a 25 meter resolution ship-based multibeam sonar system before eventually using a Mapping Autonomous Underwater Vehicle to scan the seafloor at a 1 meter resolution.
MBARI designed a mapping toolsled with a hydraulic ram that’s capable of rotating the frame carrying all of the onboard sensors so that complex terrain, like vertical structures, can be accurately mapped. This mapping toolsled is flown at just 3 meters in altitude, and uses sonar, LiDAR, and stereo photography (illuminated by strobe lights), in order to map the seafloor. The sonar is capable of mapping at 5 centimeter resolution, lidar mapping is capable at 1 centimeter resolution, and photography is done at a millimeter scale because of this low altitude. The LiDAR is also capable of imaging the animals that are present, and the photographs taken are precise enough to identify species and show if the animals are alive or dead in order to quantify them. These images can then be geo-referenced to the bathymetric maps produced through the sonar and LiDAR data.
Video: Expedition to Sur Ridge: Exploring deep-sea coral and sponge gardens just off Big Sur
This comprehensive mapping allows researchers to study the geological, geochemical, and biological processes that alter the seafloor, as well as enable studies of habitats at the scales of the animals that live there. So, in a span of eight years, we have gone from knowing very little about this region, to being able to reconstruct this large underwater feature in great detail. A video of this reconstruction can be found here!
Deep learning and remote sensing techniques in Archaeology
For our final case study, let’s look at how deep learning and LiDAR data are impacting archaeological practice!
Archaeologists have been increasingly incorporating deep learning and remote sensing techniques into their workflow because it can take a really long time to identify objects or potential structures in the field and it can be nearly impossible to sift through all of your data if you’re dealing with a fairly large study area.
Furthermore, remote sensing mitigates the issues of site accessibility as some regions may be difficult to access due to conflict, visas, or dense vegetation. So, by developing or incorporating deep learning, like convolutional neural networks (CNN), and remote sensing into archaeological practice, we’re able to explore topographical data and imagery that covers a large area in a much shorter and quicker period of time.
This is especially useful for site and feature identification. For example, in Norway, a research team wanted to develop automated mapping tools to improve the cultural heritage mapping of the country so that large areas could be quickly mapped in detail within a shorter timeframe and with a more cost-effective budget. Their focus was on identifying three types of features in the landscape: grave mounds, pitfall traps, and charcoal kilns.
Using LAS data, they generated a local relief model from a Digital Terrain Model (which is like a DEM except that a DTM includes all surface features), and then trained a region-proposing convolutional neural network (R-CNN) to identify these features.
A similar study was done in Arran, Scotland, where the research team initially focused on identifying three monument classes: prehistoric roundhouses, shieling huts of medieval or post-medieval data, and small clearance cairns. They took a similar approach. They generated a DTM from LAS data and then created a simplified local relief model (SLRM). They then trained the convolutional neural network with known locations of roundhouses, shieling huts, and small cairns, so that the CNN could learn the characteristics of each monument in order to successfully identify them, and then they ran it.
Both studies found that CNNs and R-CNNs have great potential for automating archaeological mapping, but that there is still room for improvement in the accuracy of the results. However, this is still a valuable tool for archaeologists and computer scientists to develop further!
Video: Semi-automatic mapping of cultural heritage in Arran, Scotland, using deep neural networks
Finding and Viewing DEMs
Where can digital elevation models be downloaded?
There are typically three places where Digital Elevation Models can be downloaded: Government portals, University portals, or through pay-to-use sources.
Most governments provide freely available geospatial data, like DEMs, because it’s a part of maintaining an accessible, standardized, and organized geospatial infrastructure. Once the data is collected by an organization, it can be uploaded and can easily be shared and accessed by any number of users for their own purposes, which is also cost-effective. In Canada, you can use the Open Canada website, which is a searchable geospatial database with material made available by all provinces and territories. Although not a government website, the Canadian GIS site lists all open geospatial databases maintained by Canadian provinces and territories, and these lists also provide links to open geospatial data sites maintained by individual Canadian cities.
In the United States of America, there are three open geospatial portals that you can search for DEMs. There’s AppEEARS and EarthExplorer, where you can download the Aster Global Digital Elevation Model at 30 meters resolution and Shuttle Radar Topography Mission (SRTM) data at 30 meters resolution, respectively. Both portals require the use of an Earthdata login account, which can be made at no cost. Finally, LiDAR, as well as DEM data, can be accessed through 3DEP’s LidarExplorer, which provide LiDAR data at 1 meter resolution, and DEM data at either 10 meter or 30 meter resolution.
In Europe, you can obtain free DEM data at 25 meter resolution through the Copernicus Land Monitoring Service. However, you need to create an account, free of charge, in order to complete the download.
In Australia, you can access DEMs through Geoscience Australia, where DEMs of 5 meters and 30 meters can be downloaded. If New Zealand is your study area, then DEMs can be freely acquired through Land Information New Zealand.
Universities are also a great place to look for digital elevation models because they might provide links to open data portals available within the country that the university is in, portals created by other countries, or global geospatial portals. For example, the University of British Columbia (here or here), Simon Fraser University, Queen’s University, Ryerson University, and the University of Toronto are all great places to begin your search. However, geospatial data are obtained through academic licensing so any geospatial data that the university has can often only be accessed by affiliated students, faculty members, or staff, and sometimes a request form needs to be filled out in order to request licensed data that is not directly available through institutional websites.
Although ArcGIS Hub is a part of Esri, a pay-to-use GIS software company, you can search for digital elevation models on Hub and your search will return with entries from government organizations in GeoTIFF format, or sometimes ASCII format, that can, in some cases, be freely downloaded.
Paid sources can also be an option if you’re looking for higher quality data or for data that has yet to be made publicly available. L3Harris Geospatial offers many digital elevation datasets and has partnered with companies like Airbus and PlanetObserver to provide multi-resolution Digital Elevation Model coverage of the earth’s surface. They have offices worldwide.
Apollo Mapping also provides a platform to purchase DEMs in various resolutions. Earth Observing System sells high resolution images from a number of satellites (PLÉIADES 1 (1A, 1B), SPOT-5, SPOT 6, 7, KOMPSAT-3, KOMPSAT-3A, KOMPSAT-2, and SUPERVIEW-1). On board SPOT-5 are stereo instruments which allow for the collection of stereo images that can then be used for 3D terrain modeling. Although DEMs are not directly available, there are plenty of satellite sources available with a variety of sensors onboard from which you can generate your own geospatial data from!
Alternatively, there is Maxar Technologies, which provides access to Earth Observation and SAR data from the DigitalGlobe and MDA satellite constellations. If you’re in Canada and looking to hire a LiDAR survey company, LiDAR Services International, LSI is a Canadian based company that has been in the field since 2002 and has completed projects throughout Canada, the USA, and in Africa, Asia, Central, and South America.
Download 30 meter (1 arc second) digital elevation models
- USGS Earth Explorer
- https://earthexplorer.usgs.gov/
- Space Shuttle Radar Topography Mission (SRTM) data, temporal extent: 2000.
- ASTER Digital Elevation Model (GDEM), temporal extent: 2000-2013.
- ALOS PRISM Global Digital Surface Model, temporal extent: 2006-2011
- Ontario GeoHub
- Interferometric Synthetic Aperture Radar (IFSAR)
- Copernicus, temporal extent: 2011, spatial resolution: 25 meters.
Download 10 meter (⅓ arc second) digital elevation models
- 3DEP Lidar Explorer, only for the USA.
Download 1 meter digital elevation models
- 3DEP LidarExplorer, only for the USA.
- LiDAR and DEMs available at 1 meter and 3 meters (1/9 arc-second)
- Ontario GeoHub
How can I open digital elevation models?
There are a number of free and paid GIS and CAD software that can be used to open DEMs. Let’s start by looking at some of the free GIS softwares out there.
QGIS is freely available to download and integrates its own toolset with those from other established open source GIS like SAGA and GRASS toolsets, as well as user-created plugins so you can use this GIS for a diverse number of tasks, including terrain analysis. It has a smaller installation size and computational requirements than other GIS and there are rapid updates, plugins and patches for the program because of its significant user-base. There’s also extensive online documentation that can be consulted when using one or multiple functions. You can also install the QGIS Cloud plugin which is a Web-GIS platform where you can publish maps, data, and services for public access. You can also opt for the paid version, QGIS Cloud Pro to limit access to your maps. There are two main download options for Windows: OSGeo4W Package, which is best suited for advanced users because it automates updates and avoids duplicating packages used by many other GIS programs, and the standalone installers. There are also download options for macOS, Linux, BSD, and also apps for mobile or tablet!
Whitebox GAT can also be downloaded for free. It’s best known for its advanced geospatial data analysis and it’s an excellent open-source GIS for LiDAR data because it specializes in terrain analysis! However, there are plugins that extend the functionality of the WhiteboxTools open-core and these need to be purchased.
gVSIG is another free GIS software to download which features OpenCAD Tools and has 3D capabilities. SAGA GIS is a classic in terms of free GIS software and although not particularly the best in cartography it specializes in geoscientific analysis and is capable of processing LiDAR data and offers 3D visualization.
Finally, GRASS GIS is another open-source GIS software that was built for vector and raster geospatial data management, geoprocessing, spatial modeling, and visualization and specializes in digital terrain manipulation. Any of these options would be useful for generating digital elevation models.
In terms of commercial options, there’s ArcGIS, developed by Esri, which is the main software company out there. However, it’s not the only one!
CARTO is a pay-to-use geospatial web service that’s particularly useful for mapping. You’re able to create maps using data hosted in your CARTO account and CARTO also provides ASTER global digital elevation model data at a 30 meter resolution. Pricing is offered for teams and organizations but soon they will offer an individual pricing option.
IDRISI/TerrSet (Clark Labs) software specializes in remote sensing data and is primarily oriented towards raster processing, however, it also offers a suite of GIS processing tools for GIS and environmental applications. There’s also Geomedia (Hexagon Geospatial), a GIS, remote sensing, photogrammetry, and data management software that’s been in the business for over 40 years; a rival to Esri. Another alternative is AutoCAD Map 3D, a software which combines both CAD and GIS capabilities. This software effortlessly renders spatial data in 3D. You can also incorporate GIS data into Autodesk’s Civil 3D software, which can be used for surface modeling through point cloud data (LiDAR).
Tutorials
QGIS
- For LiDAR to DEM, click here or here.
- To create contour lines from a DEM, click here.
- Best DEM plugins
Civil 3D
- To import a DEM file into Civil 3D, click here.
- To create a TIN surface from a DEM in Civil 3D, click here.
- To create a DEM surface in Civil 3D, click here.
- Export Surface Data to a DEM file, click here.
- To create a Grid Surface from a DEM, click here.
- usgs dem to civil 3d
- To create a Civil 3D surface from a TIFF file, click here.