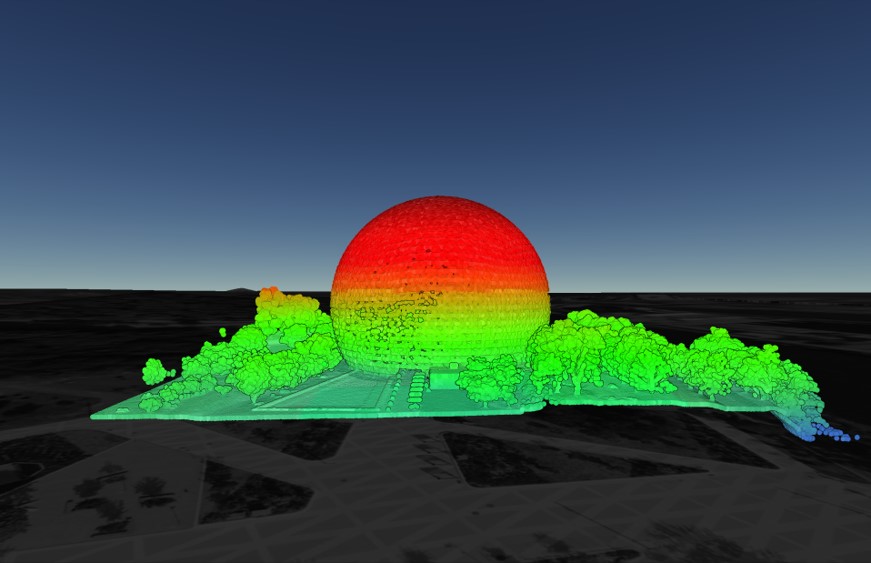
Discover the HIDDEN Accuracy of Your LiDAR Data
Mastering LiDAR Quality: A Quick Guide to Understanding Metadata and Accuracy
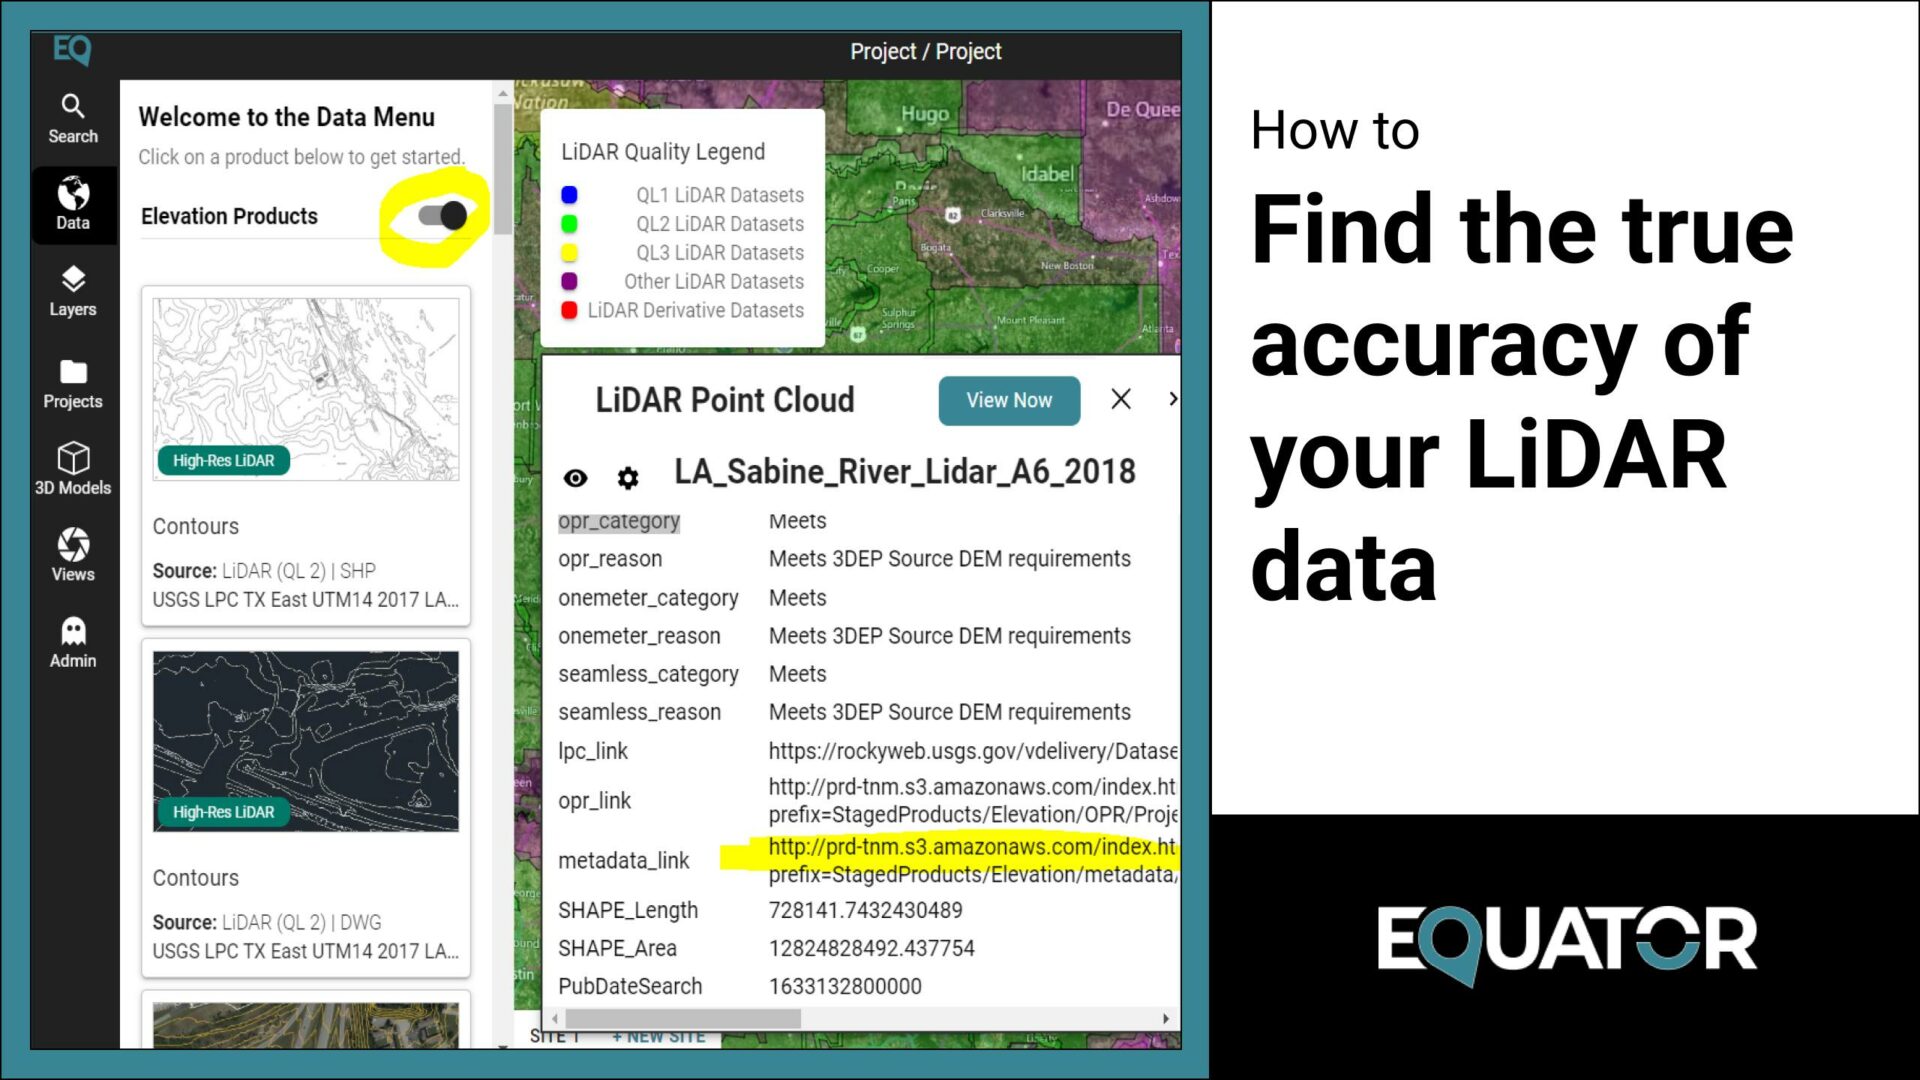
It all starts with the USGS LiDAR Quality Levels

This legend appears on Equator’s interface when you turn on the Elevation Products. But what does it mean?
The varying quality levels (QL) are defined by the vertical accuracy RMSEz, as well as a few other metrics including Nominal Pulse Spacing (NPS), Nominal Pulse Density (NPD), and Digital Elevation Model (DEM) size.
What is important to you as the Equator user is: the lower the QL, the more accurate the USGS dataset.
QL Describes the Vertical Accuracy
USGS has identified Vertical Accuracy RMSEz standards for each quality level, shown in the table below. These standards refer to the vertical accuracy RMSEz for LiDAR point clouds in non-vegetated conditions.
| USGS Dataset Quality Levels | Vertical Accuracy RMSEz (cm) |
|---|---|
| QL0 | 5cm |
| QL1 | 10cm |
| QL2 | 10cm |
| QL3 | 20cm |
Note: this table, taken from USGS Base Specifications (2022 rev. A) shows only one of the four defining metrics of the quality levels. RMSEz statics is used to assess the vertical accuracy of LiDAR point data in non-vegetated terrain only.
Why Vertical Accuracy?
LiDAR accuracy is generally stated in vertical direction as the horizontal accuracy is indirectly controlled by the vertical accuracy
What Actually is RMSEz?
RMSE is the root measure square error. It is the difference between the predicted values (LiDAR elevations) and true values (ground truth elevations). It tells us the error in the LiDAR values.
RMSE is always positive and a value of zero reflects a perfect dataset. While this is the ideal situation, it is extremely rare that anything is absolutely perfect. So, the closer the RMSE is to zero, the higher the accuracy of the dataset.
But did you know, the data can be more accurate than the QL suggests?
Surprise! It is true!
Have you heard of absolute accuracy? Absolute accuracy refers to how close the LiDAR measurement is to its “checkpoint” location. Checkpoints are the actual real-world locations of these points determined through GPS survey techniques.
Note: Some metadata reports refer to absolute accuracy as “tested accuracy”, “measured accuracy”, “observed accuracy”, or “accuracy assessment.”
Let’s Look at an Example
Check out this table below, taken from the NY FEMA-Central Zone FOCUS on Accuracy Report by Quantum Spatial. The absolute accuracy (shown as observed in this table) is 5.33cm, much lower than the classified (shown as required in this table) accuracy for the LiDAR point cloud in non-vegetated conditions.
| Observed | Required | |
|---|---|---|
| RMSE | 5.33 cm | 10.00 cm |
| 95% Confidence Level | 10.44 cm | 19.60 cm |
| Mean | -1.27 cm | N/A |
| Count | 41 | N/A |
Table from Quantum Spatial’s NY FEMA – Central Zone LiDAR Accuracy Assessment FOCUS on Accuracy Report,August 2017, for the LiDAR point cloud in non-vegetated conditions.
How can you determine the absolute accuracy of USGS’s dataset?
The tested accuracy is located in the metadata report associated with each USGS dataset. In the Equator platform, follow the following steps:
- In the data tab, slide the Elevation Products tab on
- Select the USGS dataset
- In the popup, look for the “metadata_link”
- Open the link, then select the reports/ link
- Based on the location, the metadata will varying reports. Open the Accuracy report or the main report.
- Search for RMSEz or absolute accuracy.
Or alternatively, check out this video:
We hope this helps. Take a look at some of Equator’s other blogs and “How-to tutorials”!