The next generation of GIS tools: Create professional maps in minutes.

Introduction
GIS software is complicated.
That’s no secret. If it weren’t, you wouldn’t require years of specialized training in this hybrid Computer Science-Geography-Design field.
Nearly every industry relies on maps in some shape or form (pun intended) with varying degrees of complexity required. In most cases the use is simple: To drive home a point and persuade an audience.
While many professional applications of GIS require extensive training, skills and years of experience, the reality is that many mapping applications are straightforward. For example:
- Showing the location of transit routes in proximity to a property that is for sale,
- Visualizing the topography of a drainage system, or
- Presenting a high level concept of a new subdivision
GIS specialists are trained to perform complex analytical tasks such as spatial analysis and modelling. So why are we wasting their time with simple maps?
In this article, we will explore applications of GIS for communication and design and why existing professional GIS tools are overly complex for many user’s needs. We will provide an overview of QGIS – one of the most popular and important open source GIS platforms, a popular choice for many professionals. We will then highlight the civil engineering industry and provide specific examples of mapping applications that are overly complex in QGIS. Finally, we will introduce our solution, Equator, and describe how it fulfills the needs of civil engineers (and other associated professionals) for finding, building and sharing maps in minutes.
This article was written for all professionals who rely on spatial data, who use maps for the purpose of communication and design, such as:
- Civil engineers
- Landscape architects
- Real estate professionals
- Environmental service providers
- Architects
- Construction professionals
QGIS Background
We can’t begin this article without first giving proper credit and respect to the QGIS project. It is an incredible community-driven initiative that has provided high-calibre spatial analysis tools to a global user base without the barriers of cost or format limitations.
The Quantum GIS (QGIS) project has become one of the most popular applications for mapping and working with spatial data. QGIS is a completely free, community-driven and open-source GIS platform that is available on all platforms, best known for their desktop version.
Being a totally volunteer-driven project, the community welcomes contributions in the form of code, bug fixes, documentation and advocacy in order to continue to grow and maintain the free initiative. QGIS functions as a robust GIS product, allowing users to create and export detailed maps and analyze spatial data. The platform supports a wide range of vector, raster and database formats, making it a flexible format-agnostic product.
QGIS is used worldwide by hundreds of thousands of users for a wide range of uses including forestry, city planning and climatic mapping. The platform was even used for security planning at the most recent royal wedding between Prince Harry and Meghan Markle.

QGIS has grown as a welcomed response and alternative to other professional GIS software packages such as ArcGIS and MapInfo, providing GIS professionals with a free solution that is fully-functional and well documented. It represents a success story of a community that felt a need to broaden their reach and impact by providing GIS power users with an ever-evolving custom toolset.
QGIS is a remarkably powerful tool suited best for those with specialized GIS skills and a need to conduct complex spatial analyses. However, given the feature and development-driven nature of the software, it may not be the first choice for those who need to create more basic maps nor those without formal GIS training.
The Equator Story
Working as an Environmental Engineer, I spent 10 years learning how to use CAD software like Civil 3D. I am not a pro by any means, but I can create a solid drainage catchment or SWM pond concept.
Recently, a project came up that required me to use GIS software for basically the first time. Our office used both ArcGIS and QGIS, which are the two most widely used tools for professional mapping applications.
Very quickly I learned that QGIS and ArcGIS are built for the handful of professionals in an engineering firm with specialized GIS training, leaving the majority without the ability to create simple, yet professional maps.
I was surprised at how much I struggled to get up to speed, and how much time I spent on Google to learn the basics…

“QGIS tutorial”
“Where is processing toolbox in QGIS”
“How to merge layers in QGIS”
“QGIS attribute table tutorial”
“Why is QGIS so slow”
“Why am I so slow”
“How to retire at 35”
It took me days to create a few simple figures.
The punch line: Instead of just spending 40 hours to improve my GIS skills, I decided to quit my job, build a team and spend months creating accessible GIS software called Equator. We jumped on a huge opportunity to make professional mapping more accessible to everyone. True story.
Equator is mapping software that allows anyone to find, build and share maps in minutes.
Equator is essentially mapping for the whole team. We recognized the other CAD and GIS products are designed for and well used by those with specialized training. As a result, we’ve made our greatest differentiator to be ease of use. We empower all staff who rely on spatial data to find the information they need, and to communicate efficiently and effectively with this data. Think of Equator like Google Earth meets PowerPoint, but with lots of built-in data.
Our powerful web-based mapping toolkit has been designed to enrich the civil engineering workflow from end to end. We do this by providing data, design and communication tools accessible by all staff to fit in with your existing workflow.
The primary uses for Equator can be summed up like this. We help you:
- Uncover meaningful location insights
- Create professional visuals in minutes
- Facilitate seamless communication
- Unlock the potential of all staff – Equator is for the whole team!
At Equator, we believe that everyone should have the ability to communicate their ideas spatially using professional quality tools, without having to invest in years of training.
We would like to share with you the main reasons why QGIS is not always the most efficiency tool to use when creating maps and figures, and how Equator can be used to significantly enhance your workflow.
Opportunity 1: Sourcing Data for QGIS
Any map, figure or concept plan begins with sourcing background data. For example, satellite imagery, topography, or environmental information.
This can also be the most time consuming part of making a map.
The fact is that digital geospatial data is exploding, yet the average professional does not have access to a central location to pull this information from. The inability to efficiently leverage this data is a real missed opportunity.
While background data can be added to QGIS, for a novice mapmaker, opening up QGIS to a blank canvas and having to find all of your data without direction can feel like an overwhelming task.

Screenshot of QGIS main user interface, October 26 2020.
Our Solution:
Equator provides access to a massive library of public map layers, imagery and 3D terrain, indexed and searchable right at your fingertips.
Tap into tens of thousands of layers for municipal infrastructure, LiDAR, environmental data, traffic, and more. Find the base maps you need in minutes.

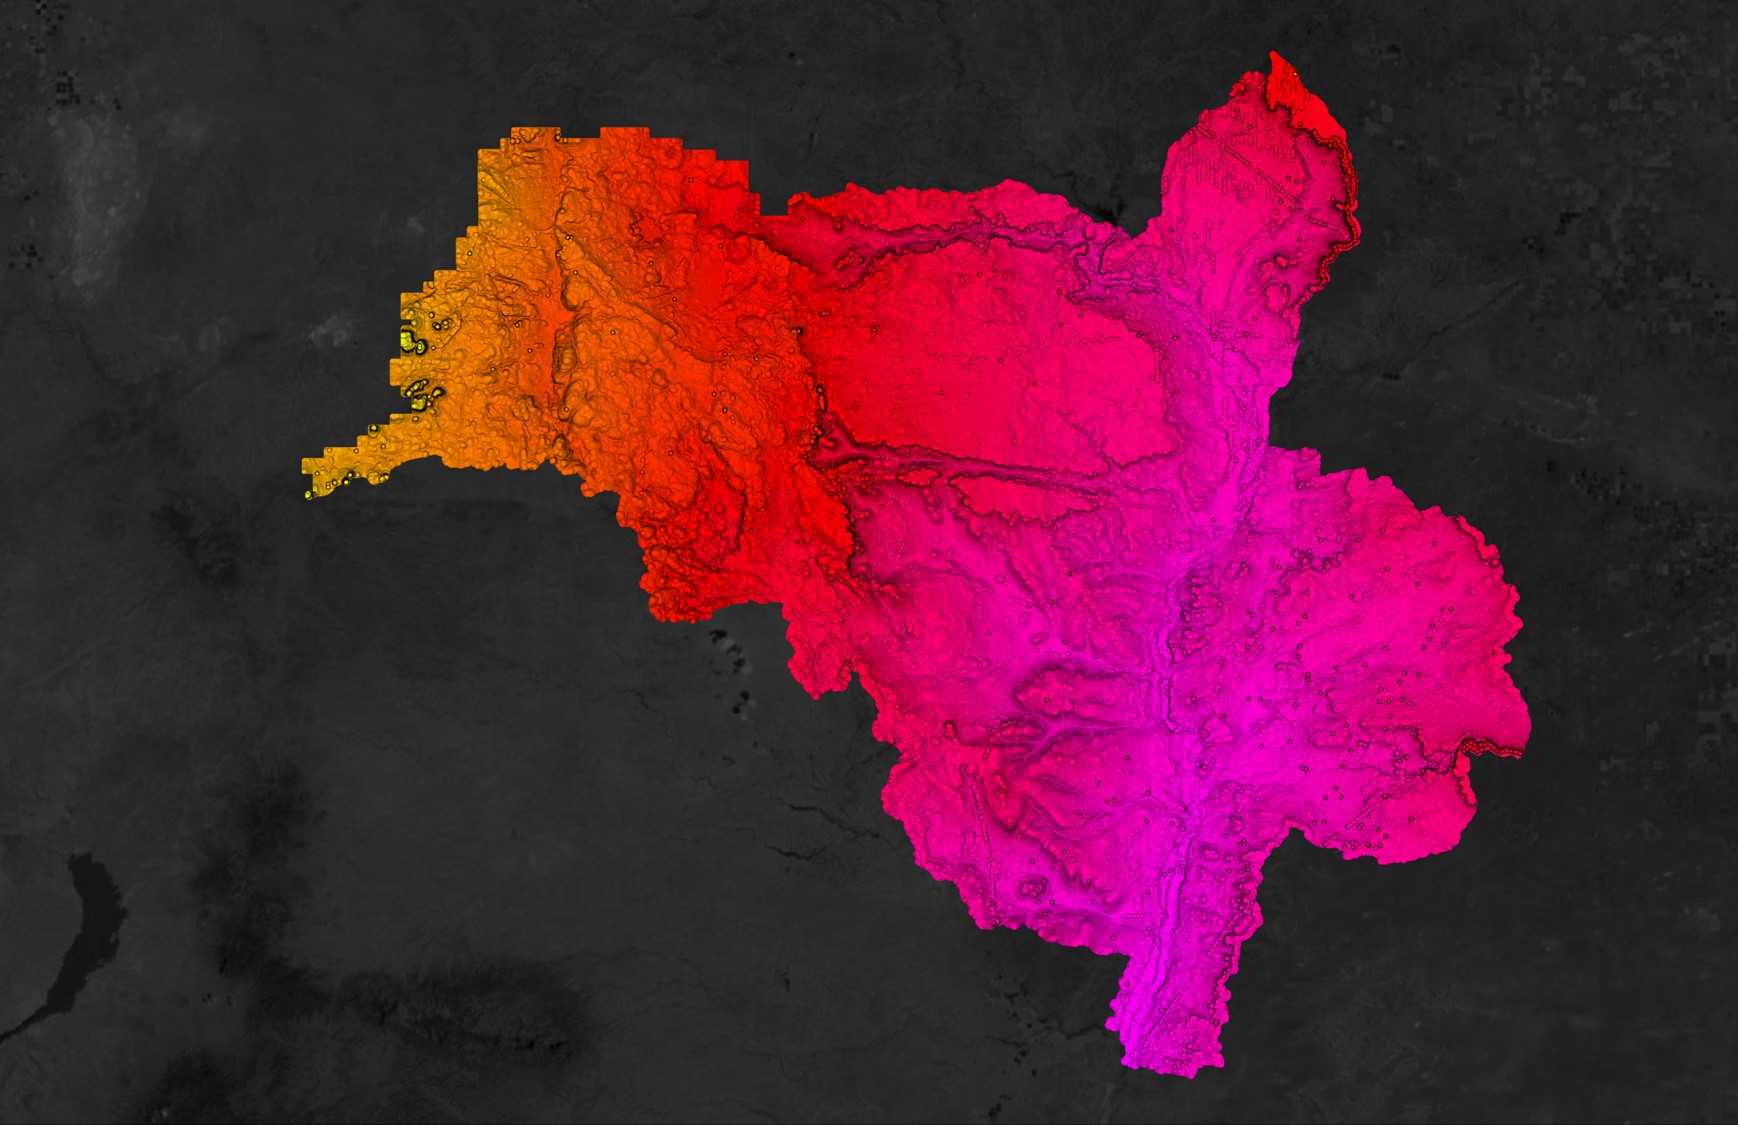
Screenshot from Equator showing data layers in Kamloops, BC.
Here’s how it works:
Opportunity 2: Designing Maps for Reports and Presentations
Maps are an essential form of communication, and can be instrumental in driving a point home or persuading an audience.
When creating for an audience, we believe more emphasis should be placed on designing standout visuals rather than being consumed by a process.
In QGIS, The primary vehicle for publishing a map is the Print Composer. Believe it or not, it’s actually quite difficult for a novice user to produce a high quality result without spending hours on google first.
Some light digging online reveals thousands of repeat questions and articles about how to accomplish certain key tasks with the QGIS print composer, and almost as many users expressing frustration.
For instance, something as simple as labelling your map in QGIS or aligning two map views side by side requires a custom solution (sometimes even lines of code!) to accomplish. Adding additional markup, shading and title blocks also requires users to navigate multiple menus and custom adjustments.
For polished map design, many QGIS users are relying on additional design software to finalize maps for publishing. There are hundreds of tutorials on the internet just explaining how you can export a map from QGIS and import it into Illustrator for further design work.
Like this one:
Our Solution
Our belief is that creating standout maps in minutes in Equator should be as easy as writing a report in MS Word, or designing a presentation in PowerPoint.
When designing Equator, we put ease of use and a focus on the user end-goal as a top priority. Equator was designed to give you all the tools you need to create accurate and attractive maps without having to spend hours in the process. Similar to products like Canva and PowerPoint, Equator provides you with a library of templates and title blocks to serve as the canvas for your design.
Any functional and aesthetic change you need to make to your map and layout can be done with a simplified set of tools. Users can create multiple map frames, title blocks, legends, scales, icons, images, labels, markup and more all in a matter of seconds in the responsive design frame. Maps and data can be exported in a variety of formats, or shared quickly by the click of a button.
Check out this map that one of our customers designed in Equator in less than 30 minutes, using only the built in design tools and spatial data.

This short map example shows how a customer used the Canmore Roads and Canmore Trails data layers that were in Equator’s data library to create this artistic trail map. In just a few short steps, the customer selected the data, changed the formatting, and added finishing touches in our report editing tool.
Collaborative Mapping
Communicating during the design process is of equal importance to the actual design work.
Being able to review designs with clients and team members is critical for the meeting requirements and iterating effectively.
We know that GIS and engineering professionals have a growing need to collaborate remotely, especially in this pandemic era. Real-time collaboration is essential for gaining clarity on evolving objectives, visually communicating ideas effectively, and gaining consensus faster.
Collaboration isn’t as simple as a video call or screen share. Reviewing maps and drawings is a more complicated art to execute remotely – one that has historically been done around the table marking up large pages with coloured pens.
A major limitation of QGIS is the lack of support for real-time collaborative use. In the era of cloud computing and remote work, this is a top priority for users to afford more flexibility for their projects, teams and clients.
QGIS was designed primarily for desktop use, and requires working files to be saved locally and manually loaded and imported. If you would like to work in real-time with someone on a project in QGIS, it is currently not possible. As a result, users typically download the files, zip them up, email or dropbox them over to a collaborator, and then wait for them to return the process.
It appears that there is quite a significant appetite for collaborative functionality with QGIS. Many users have taken to popular forums such as GIS Stack Exchange or r/qgis asking the questions:
Can two people work on the same shapefile at the same time?
Best way to view and edit maps in QGIS with coworkers?
Versioning plugins for sharing QGIS files?
Is there a way to synchronize a QGIS map with vector layers so that multiple users can use and edit the same file?
QGIS – How do I share a map with a colleague?
The inability to work collaboratively and efficiently blend QGIS into your team’s workflow is a bottleneck for teams. Users are forced to get creative with workarounds such as cloud hosting sites and versioning plugins to share and edit maps with multiple users.
Industry leaders are beginning to adopt tools that introduce real-time collaboration into their workflows.
Take Bluebeam for example. Their product, Revu, creates one central collaborative space for engineers to markup drawings produced in CAD software. This seemingly simple concept clearly hits the sweet spot for the construction industry, as they report 94% of the top companies in this industry are using their product. This Google Doc-like collaboration is something we are all coming to expect from industry leaders without compromise, especially in the era of remote working.
There is an opportunity to ensure that professionals can perform at the same pace while working in remote arrangements, by leveraging the latest technology. We believe that creating and presenting professional maps with your team should be just as easy and engaging remotely as it is in person.
Collaborative mapping can help your organization standout as an industry leader by ideating with your team in real-time, creating and refining high-level concepts quickly, and communicating your ideas in an engaging way.
In Equator, users can invite multiple stakeholders, empowering participants to show, rather than just tell. All participants can point out features, ideate and design with the team in our 3D map canvas.
This allows everyone to leave their mark, meaning more productive meetings, faster decisions and increased project margins.

Conclusion
We believe that creating professional, stand-out maps should be easy and accessible to all.
The only finite resource ourselves and our organizations have is time, and that is what we are sacrificing in spades when relying on the old ways of doing things.
Equator is here to give you more time back in your day and the ability to focus on high-impact work with a simplified mapping and design process.
I have worked as an environmental engineer for 10 years, and in that time I have tried many solutions available for GIS and CAD. I have learned that the existing solutions tend to be overly-complicated, and bogged down with features the average professional does not need (or shouldn’t have to pay for!)
Our time and money is worth more than this, and so we are on a mission to reimagine mapping software.
Even if you’re new to mapmaking.
Even if you’re used to spending days and weeks on one mapping project.
Even if you hate mapping.
You should be able to create powerful, evocative and accurate maps without consuming days of your time.
Don’t take my word for it. You know best what you need and what you’re looking for. I invite you to try Equator to see if it’s the right fit for you.
Happy mapping!